
Google Analytics 4
What are segment overlap explorations in Google Analytics 4?
Segment overlap is a feature that can be found within the explore module in the Google Analytics 4 interface. This is a brand new template, with segment overlap not available or possible in Universal Analytics, or preceding versions of Google Analytics.
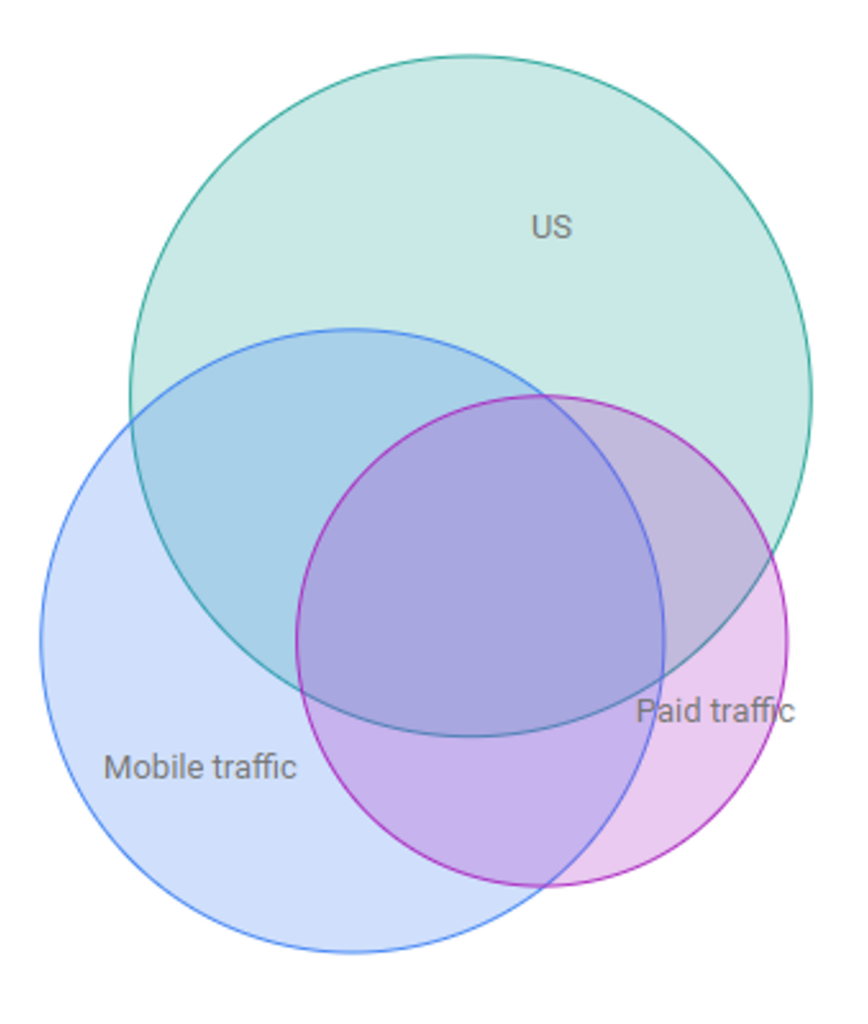
The segment overlap exploration can be run on up to three different Google Analytics 4 segments, providing a visual representation of how audiences overlap across each segment being analysed.
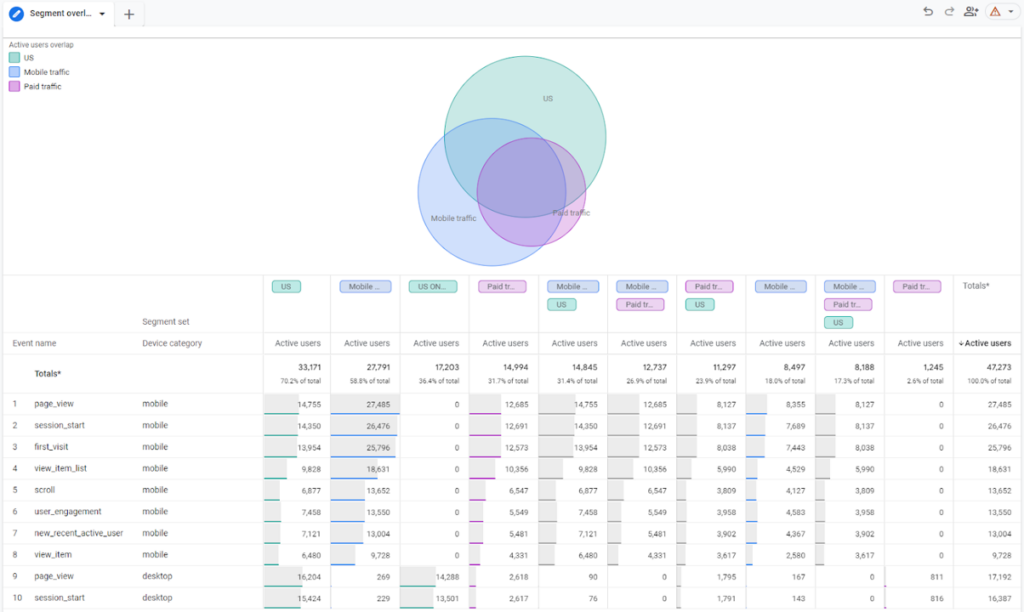
Below is an example of the segment overlap exploration, being applied to segments created on the demo Google Merch store Google Analytics 4 property, for mobile traffic, paid traffic and US traffic.
What are the benefits of using segment overlap explorations?
One of the many benefits of the segment overlap exploration is the ability to create new audience segments based on the overlaps shown.
For example, creating a segment of users who fall into both the mobile traffic and paid traffic segments.
Or, creating a segment of users who are mutually exclusive to a segment. For example users who only fall into the US traffic segment, and are not in the mobile traffic or paid traffic segments.
These new segments can be used in Google Analytics 4 to create a custom audience, which can then be used in Google Ads or for retargeting purposes. This makes the segment overlap exploration a very powerful tool for identifying new audiences to target.
Additionally, the new segments created can also be saved and used across other Google Analytics 4 explorations, providing great flexibility.
How can I find segment overlap explorations and what features are available?
Get started with segment overlap explorations by clicking on the ‘explore’ tab within the left hand navigation menu in your Google Analytics 4 property.
From here, select the ‘segment overlap’ exploration to bring up a segment overlap template similar to below:
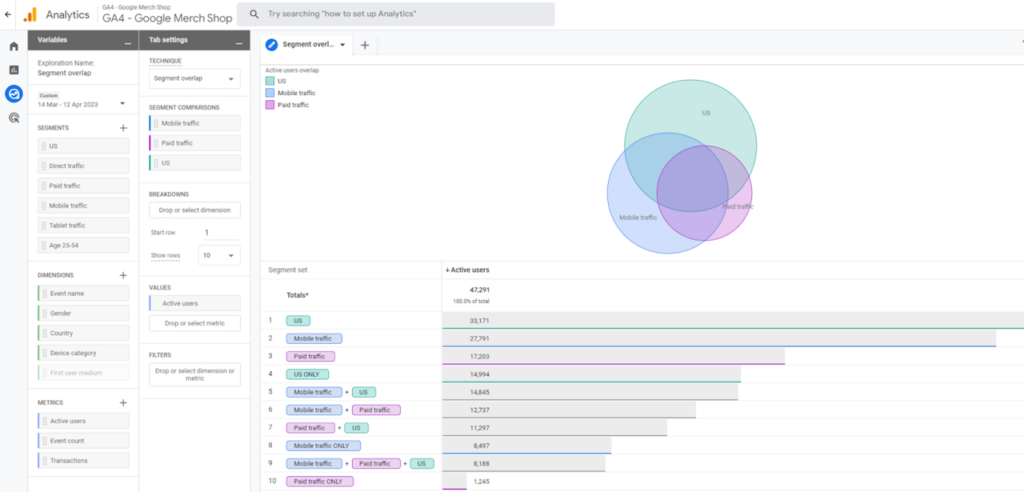
Segment overlap explorations are split into three key sections which are variables, tab settings and your visualisation. Each of these are explained further in the sections below.
What is the variables section?
The variables section allows selection of data that is needed for the exploration. There is a variety of options to select from:
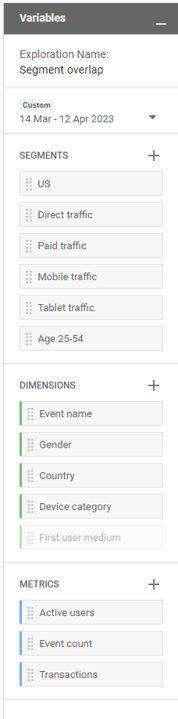
The variables options available include:
- Exploration name – We would recommend choosing a straightforward name that explains the data being visualised within the exploration.
- Date range – Choose between pre-set options provided by Google Analytics 4 such as ‘last 28 days’ or a custom range to match specific needs.Selecting the ‘compare’ options allows comparison with a different date range. This feature can be powerful at reviewing any lift in performance between selected time periods.
- Segments – The segment overlap exploration uses segments to identify overlaps. Google provides some basic segments within this exploration to get started.Clicking the plus icon enables the creation of new segments, or to access segments that exist in the Google Analytics 4 template gallery.
- Dimensions – Select the dimensions needed for the exploration. Dimensions describe data and are usually text as opposed to numbers.In the segment overlap exploration, dimensions can be used to filter an exploration, or can be added as additional breakdowns for further granularity.
- Metrics – Select the metrics needed for the exploration. A metric is a quantitative measurement and is always a number as opposed to text.For example, if interested in the overlap of segments for users who have converted, use a conversion metric such as transactions in the segment overlap exploration.
What is the tab settings section?
Tab settings are where data is selected for the segment overlap exploration. This includes the segment comparisons, breakdowns, values and filters that are required.
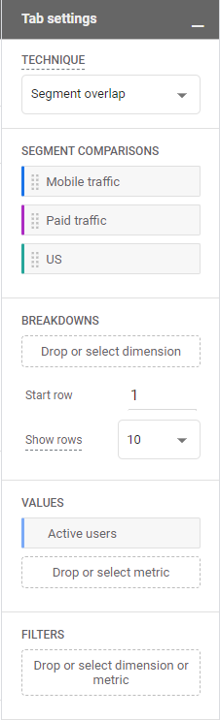
- Segment comparisons – Select up to three segments to understand segment overlaps and create new segments based on these overlaps.In the example above, mobile traffic, paid traffic and traffic from the US is being explored and analysed.
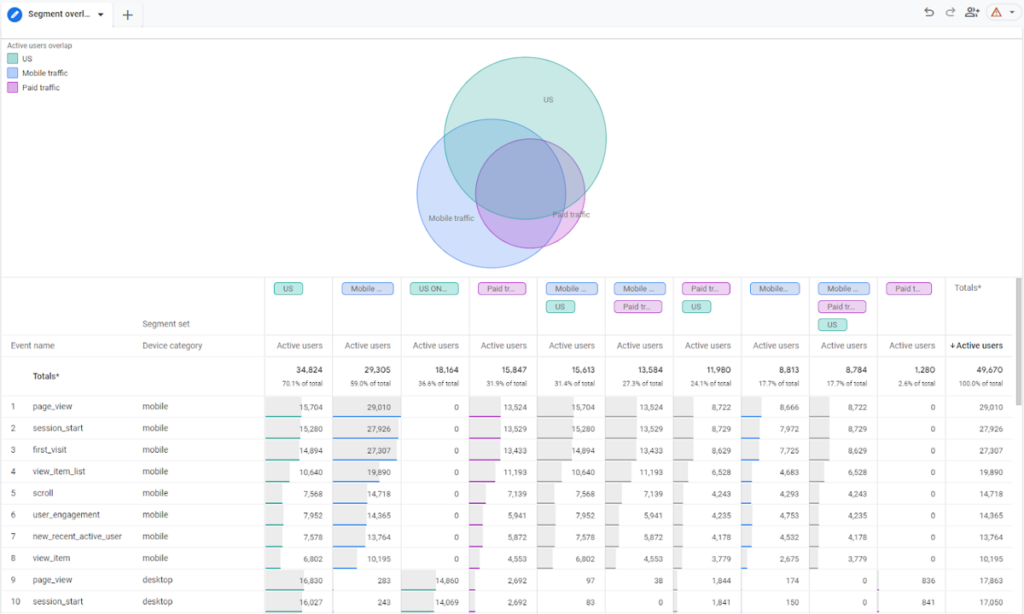
- Breakdowns – Add multiple dimensions, to understand segment overlap in even more granularity.For example, adding event name and device category breakdowns will provide more granular data as shown below. Click on the ‘+’ icon to add additional dimensions into the segment overlap exploration.Furthermore, define how many rows are visible in the table shown in the visualisation section, and filter which row you want the table to start from.
- Values – Select the metrics which are used to analyse the overlap. Either a single metric or multiple metrics can be selected.In the example above, the metric ‘active users’ has been selected for the segment overlap exploration.
- Filters – Apply either a single or multiple filters to refine the data that is included or excluded in the segment overlap exploration.Filters can be based on either metrics or dimensions, and can use a variety of logic such as contains, starts with, exact match and regex match.
What is the visualisation section?
The visualisation section is where the segment overlap exploration is viewed. This is the culmination of the configuration in the variables and tab setting sections, and what users of the exploration will see.
Change the sort ordering by clicking on the metric name or values within the visualisation. In the example below, the segment overlap exploration has been sorted by total active users in descending order.
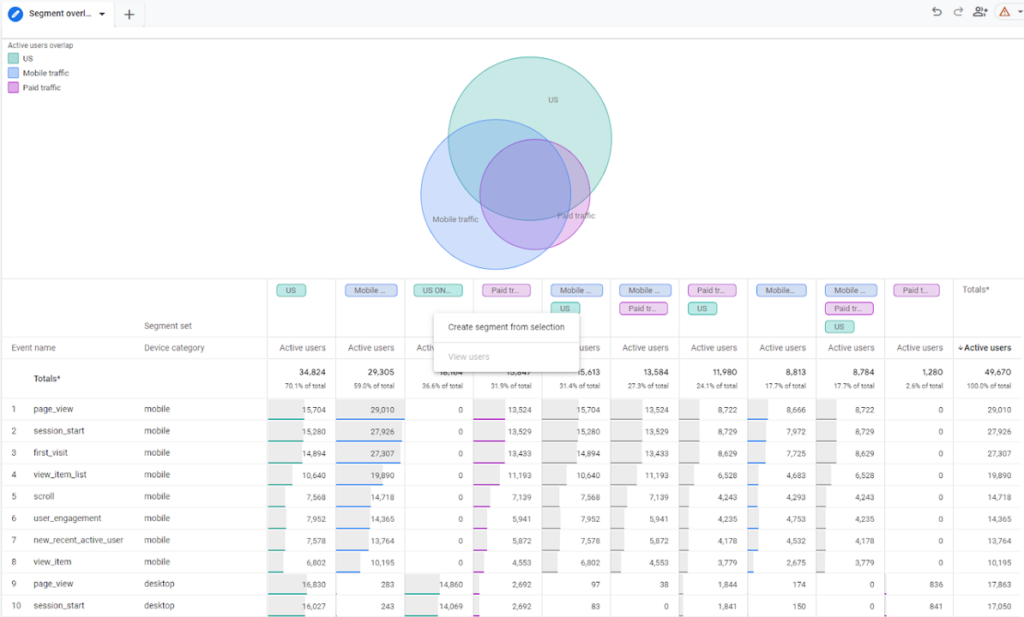
Creating new segments from the overlaps is very simple to do within the visualisation window.
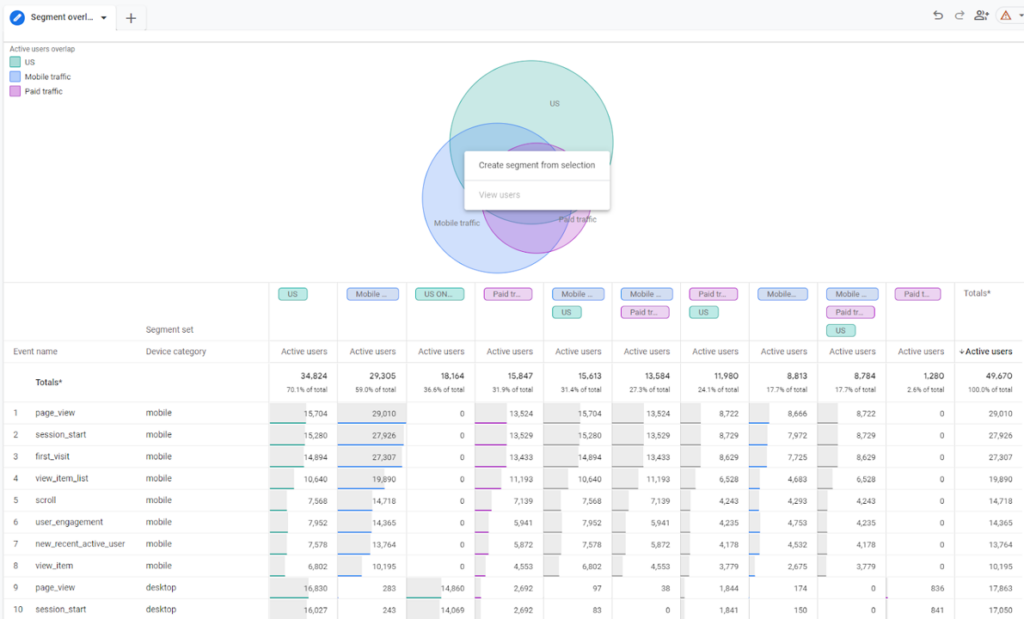
To create a segment of audience who are in both the US and traffic segments:
- Hover the mouse over that intersect in the venn diagram
- Right click to bring up the menu options
- Select ‘create segment from selection’ to open the segment build window
This will open the segment creation window, with the conditions pre-populated:
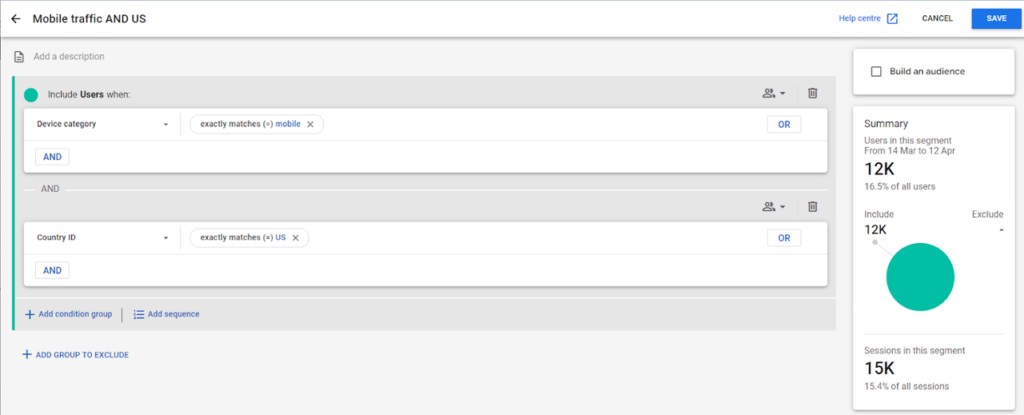
Ensure the ‘build an audience’ checkbox is enabled, should this be required for Google Ads or retargeting purposes.
Then click save, to save both the segment and the audience into Google Analytics 4.
In addition to selecting interesting segment overlaps via the venn diagram, right click on any row or column in the table and create a segment that way.
For example, let’s build a segment and audience for those users who are in the US segment only.
- Right click on the column labelled ‘US only’
- Select ‘create segment from selection’
Then proceed as above in the segment creation window to build the audience and save both the segment and audience.
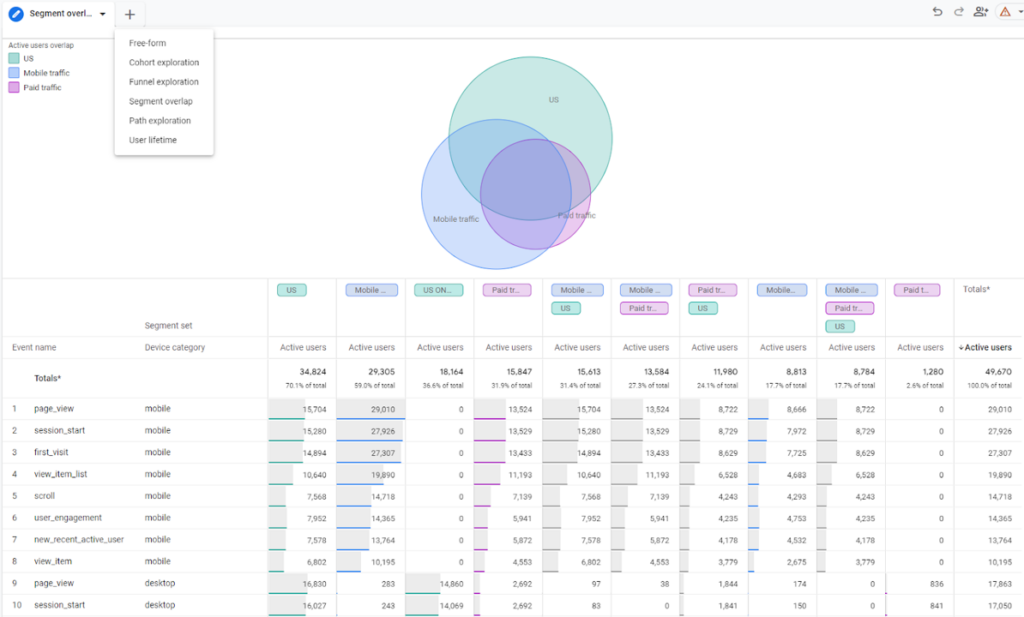
The visualisation section also allows the creation of additional tabs to build a multi-visual exploration.
Simply click the ‘+’ icon in the tabbed section at the top of the exploration to select the desired exploration type.
This will create a new tab from which a brand new exploration view can be created.
How can I get started using segment overlap explorations?
To start using segment overlap explorations, consider the potential use cases from an audience perspective.
For example, use the pre-built reports in the interface to identify cohorts of users that convert well, then use the segment overlap exploration to identify overlaps and create highly engaged audiences to use in Google Ads or for re-marketing purposes.
Because the segment overlap exploration is very flexible, it can be powerful when analysing custom data or events being collected in Google Analytics 4.
For example, if a custom event has been created to track customer status, the segment overlap exploration can be used to understand overlap across these different statuses.
We recommend investing time in building out explorations in Google Analytics 4 ahead of Universal Analytics being sunset. This will enable a smooth transition from Universal Analytics to Google Analytics 4.
Speak to us if you have any questions around the segment overlap exploration in Google Analytics 4.