
Google Analytics 4
What are explorations in Google Analytics 4?
Explorations is a feature new to Google Analytics 4 that enables you to create customised reporting.
Explorations allow you to deep dive into customer behaviour and gain critical insights that cannot be found within the standard Google Analytics 4 reports.
Explorations can be saved and shared with relevant stakeholders which can be valuable for bespoke reporting needs.
The different types of explorations in Google Analytics 4
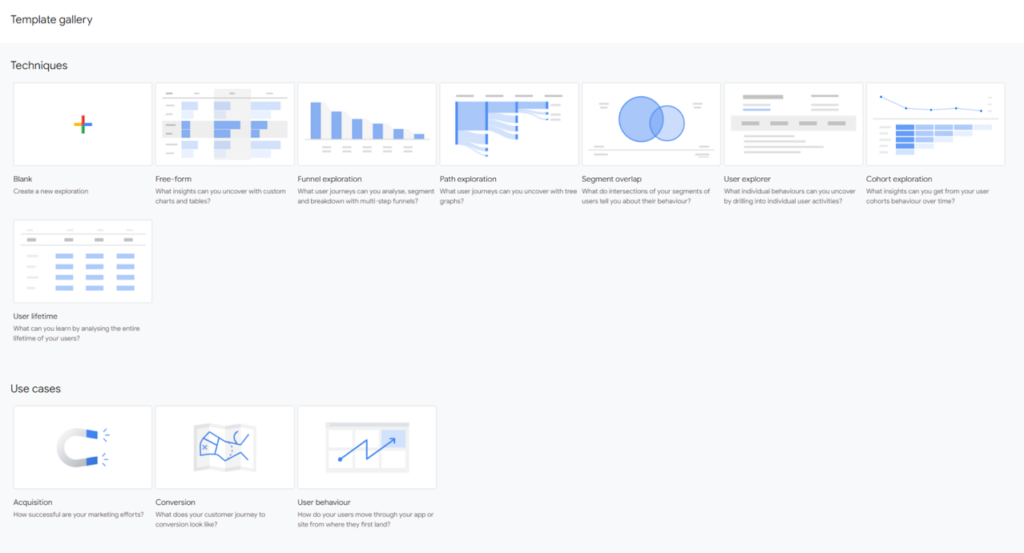
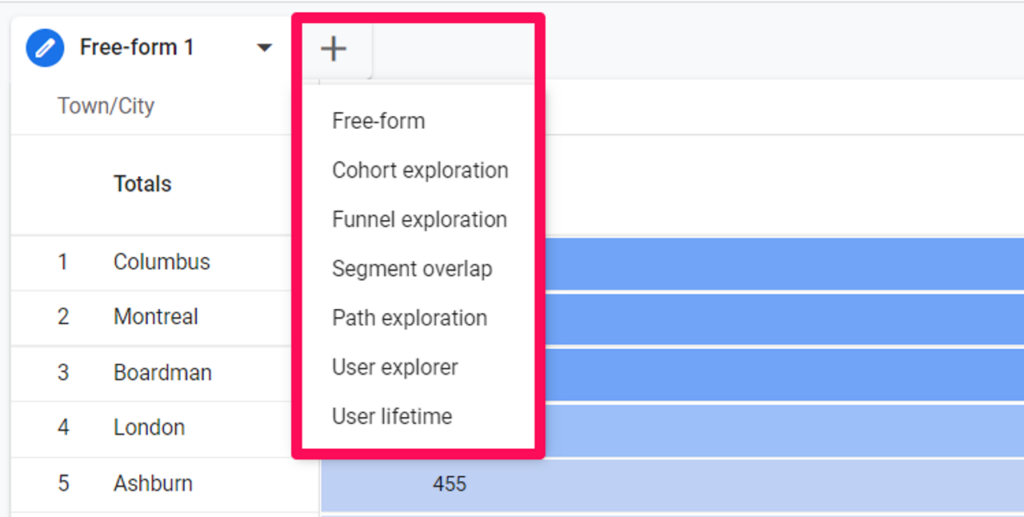
You’ll have the option to select from seven different types of explorations, which all have their own specific use cases and allow you to slice your data in varying ways. These explorations are:
- Free-form
- Cohort
- Funnel
- Segment overlap
- User exploration
- Path exploration
- User lifetime
Google Analytics 4 provides you with templates for each of these exploration types to help you get started with analysing your data. However, you’ll also be able to create your own from scratch for bespoke analysis.
What are free-form explorations in Google Analytics 4?
Free-form explorations allow you to create a fully customised dataset to your exact business and reporting needs.
They are a blank canvas for visualising your data using any of your available dimensions and metrics in Google Analytics 4.
What are the benefits of using free-form explorations?
Free-form explorations help you to uncover detailed insights about your customers. This allows you to:
- Easily and flexibly perform ad-hoc analysis.
- Create bespoke reports to your exact reporting needs.
- Add custom definitions into your reporting.
- Drill down further into your customer dataset.
- Slice your data using filters and segments.
- Export your report into other tools.
How can I find free-form explorations and what features are available?
You can get started with free-form explorations by clicking on the ‘explore’ tab within the left hand navigation menu in your Google Analytics 4 property.
You’ll then have the option to select between a ‘free-form’ or ‘blank’ exploration. We would recommend starting off with the ‘free-form’ option. This option will mean that some of the initial configuration is provided for you as a starting point.
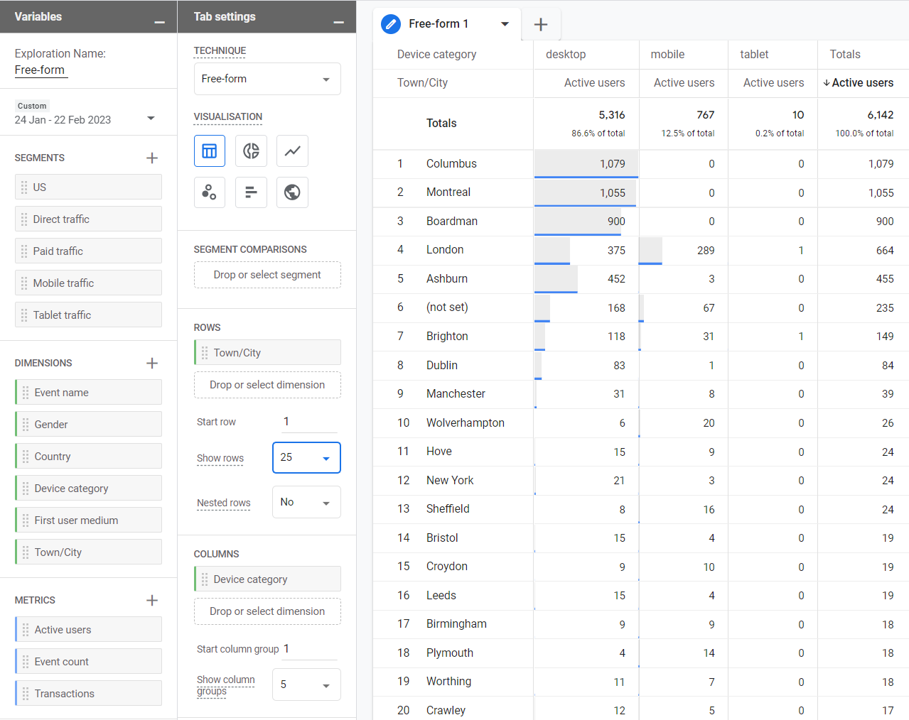
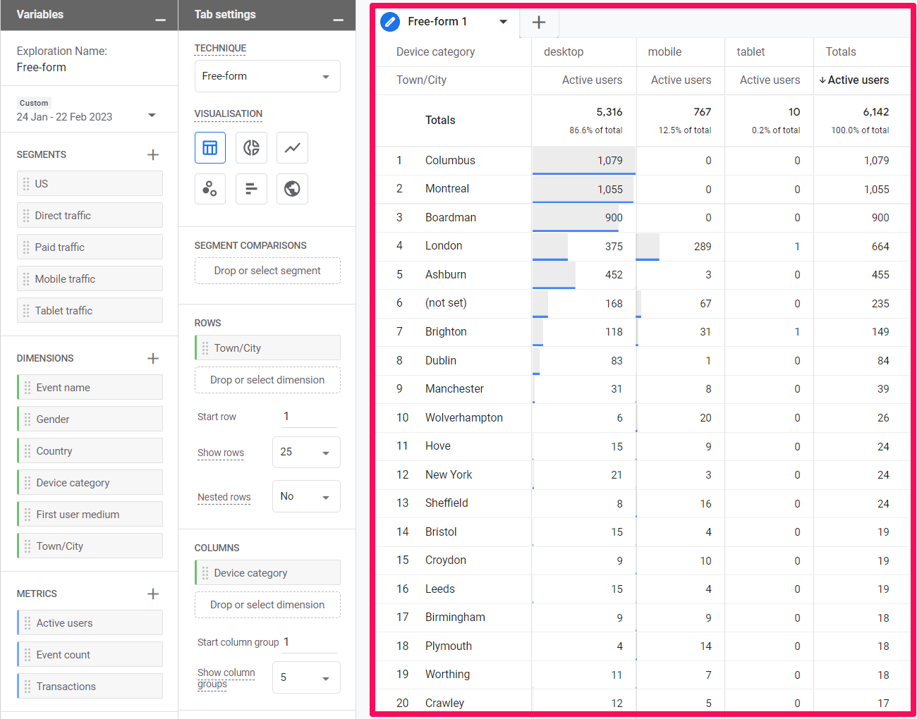
Once you’ve got your free-form exploration set up, you’ll see there is a lot of information to look at and choose from. Free-form explorations are split into three key sections which are variables, tab settings and your visualisation.
What is the variables section?
The variables section is where you select the data that is needed for your reporting. You’ll have a variety of options to select from:
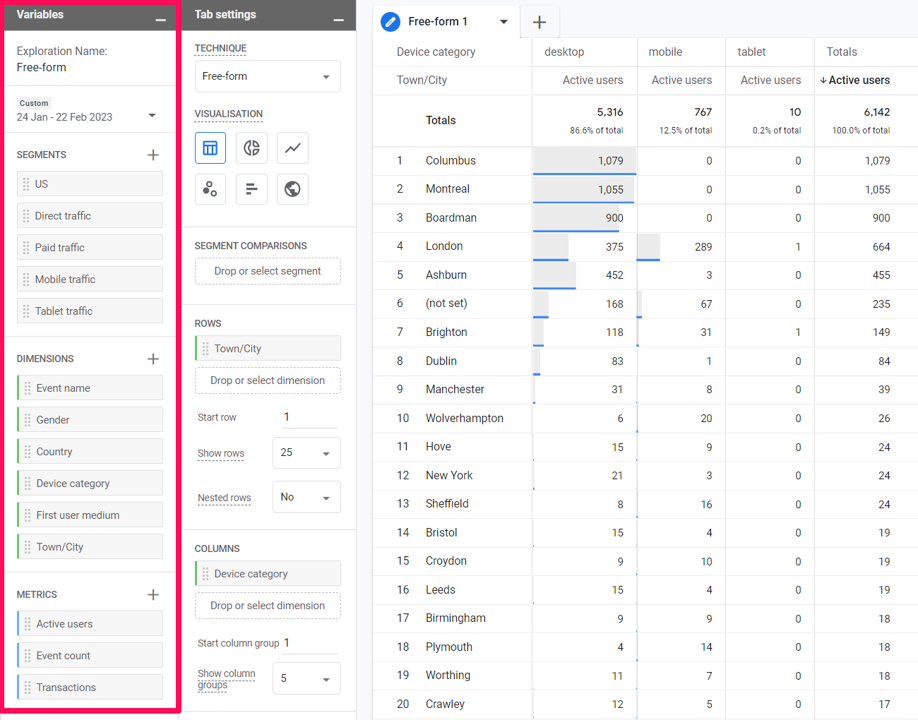
The variables options available include:
- Exploration name – This allows you to name your exploration. We would recommend choosing a straightforward name that explains the data you are visualising within the exploration.
- Date Range – This allows you to choose the data range for your exploration. You’ll have the option to choose between pre-set options provided by Google Analytics 4 such as ‘last 28 days’ or you can choose a custom range to your specific needs.
You’ll also have the option to ‘compare’ which allows you to compare your selected date range with a different date range. This feature can be powerful at reviewing any lift in performance between your selected periods.
- Segments – This allows you to slice your data in different ways by grouping your users into buckets. Google provides you with some basic segments within this report to get you started.
You can also click the plus icon in the segment section to create your own bespoke segments or find templated solutions as well.
- Dimensions – This allows you to select the dimensions you need for your exploration. Dimensions describe your data and it’s usually text as opposed to numbers.
For example, the dimension ‘Device Category’ describes the type of devices that users viewed your website/app on e.g. Mobile or Tablet.
- Metrics – This allows you to select the metrics you need for your exploration. A metric is a quantitative measurement and is always a number as opposed to text.
For example, the metric ‘transactions’ gives you the number of transactions recorded by all users within your selected date range.
What is the tab settings section?
Tab settings are where you configure your exploration. This includes the visualisation type, segments, dimensions and metrics that are required.
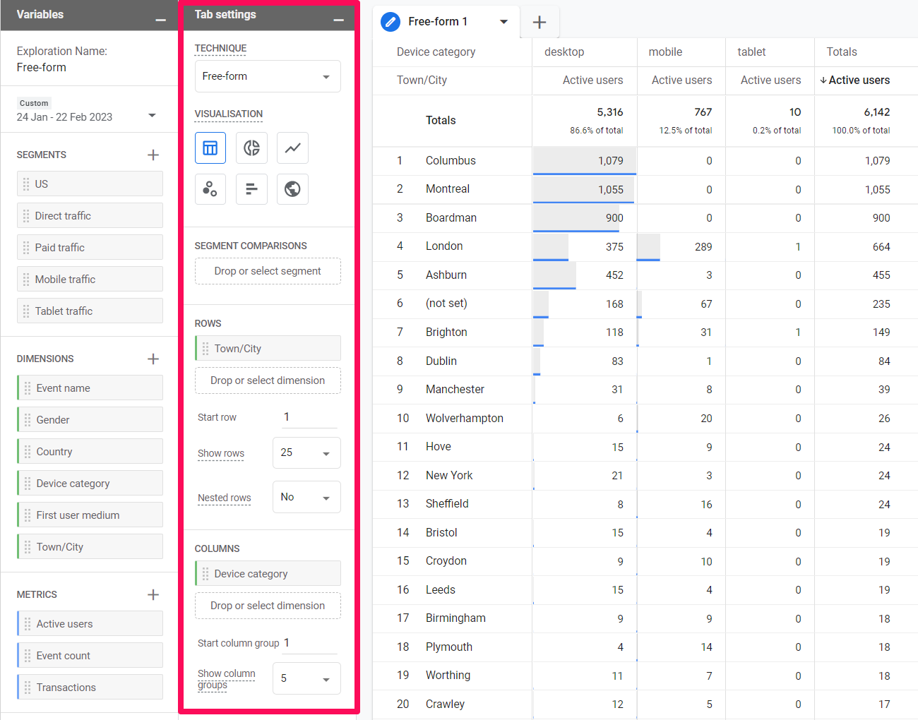
The visualisation area allows you to configure what your report will look like. You’ll have the option to choose from the following visualisation types:
- Table
- Bar Chart
- Line Graph
- Donut Chart
- Scatterplot
- Geo Map
We would recommend that you select the visualisation type which best helps to tell the story of your chosen data.
Additionally, within this section, there are further options to tailor your report to best suit your needs:
Segment comparison allows you to compare your data using the different segments you’ve selected within the variables section. Simply drag and drop your required segments.
Rows, columns and values allow you to pick and choose how you would like your data to be structured for reporting. Rows and columns are reserved for dimensions and values are reserved for metrics. These options allow you to slice and visualise your data to your specific needs.
Filters allow you to narrow the amount of data shown in your visualisation. For example, if you wanted to only show data for mobile website users, you could include a ‘Device Category’ dimension filter to only show these mobile users. This is a powerful tool for helping you tailor your report to your bespoke needs.
What is the visualisation section?
The visualisation section is where you’ll see your visualised data. This is the culmination of your configuration and what users of the exploration will see. You can change the ordering by clicking on the metric name of values within the visualisation.
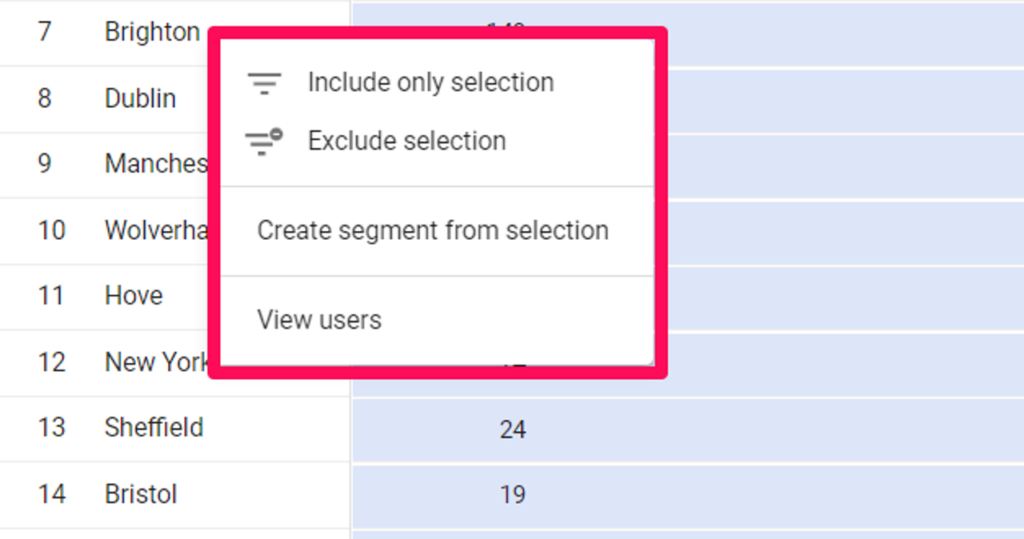
If you right click onto a row or column dimension value, you’ll have the option to create segments from users in your visualisation, filter particular values that you wish to exclude or only include and view users via the user explorer exploration report.
Additionally, you can create more than one visualisation within your exploration report. Simply click the plus icon to include another visualisation or exploration type of your choosing.
How can you get started using free-form exploration reports?
To start using free-form exploration reports, re-build custom reports you use regularly in Universal Analytics in Google Analytics 4 using this new feature. This helps you to become familiar and confident with the new explorations interface.
You should also review the standard reports in Google Analytics 4, and identify any gaps against the measurement you require, then use explorations to build new custom reports that address these measurement gaps.
We recommend investing time in building out custom reports using explorations ahead of Universal Analytics being sunset. This will enable a smooth transition from Universal Analytics to Google Analytics 4.
Speak to us if you have any questions around Google Analytics 4 explorations.