
Google Analytics 4
What are path explorations in Google Analytics 4?
Path explorations is a feature that can be found within the explore module in the Google Analytics 4 interface. This is a brand new custom template in Google Analytics 4, that builds on the pre-built ‘Behaviour Flow’ report that could be found in the behaviour menu of Universal Analytics.
The path exploration has been crafted to explore user journeys in a tree graph type visual.
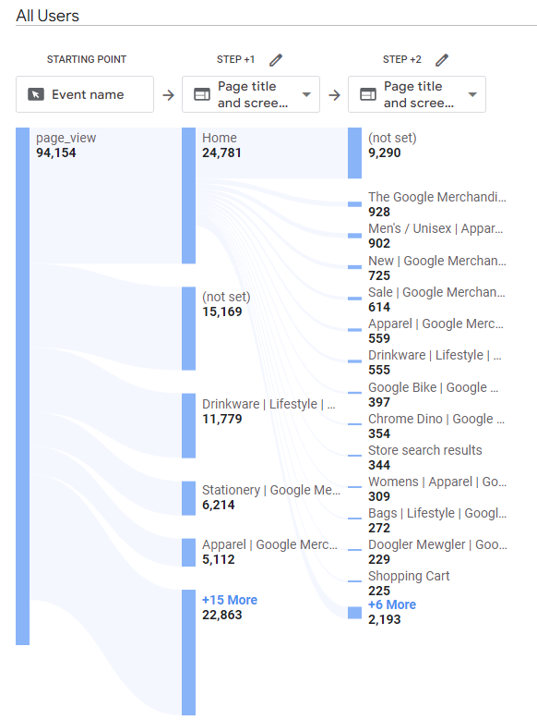
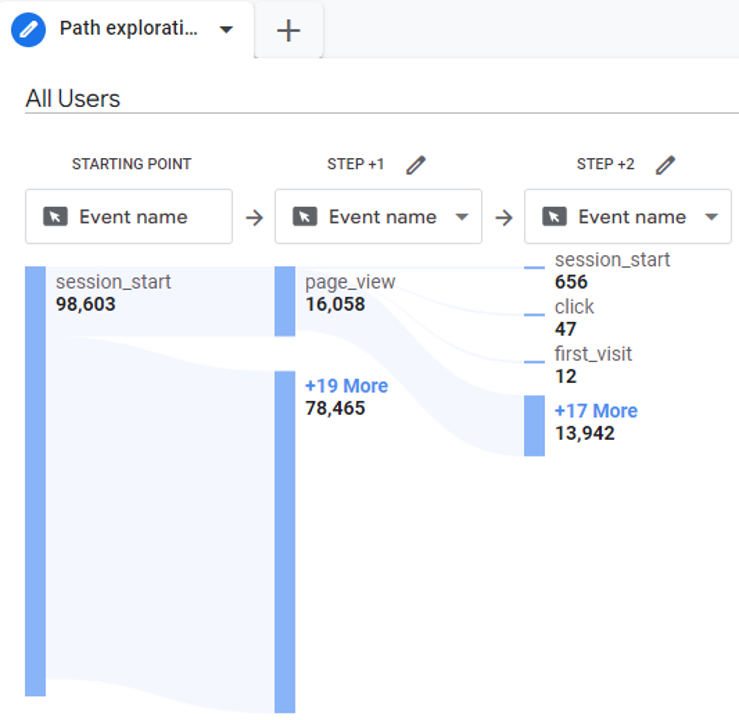
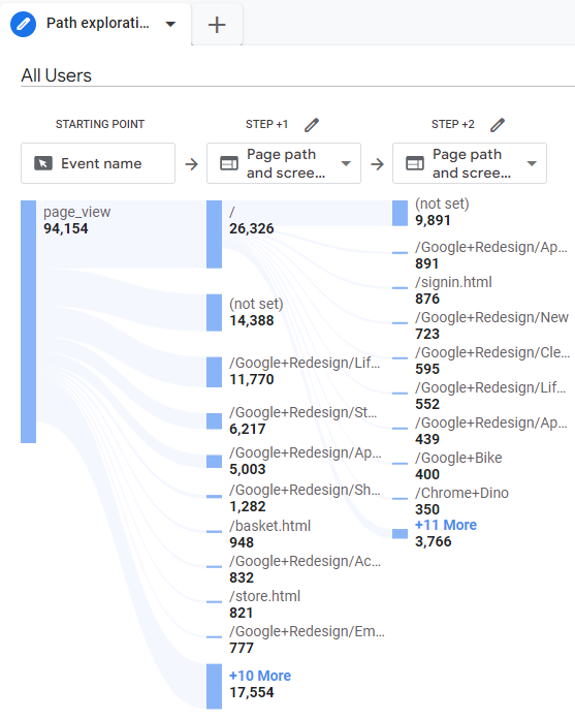
Below is an example of a path exploration taken from the demo Google Merch Store Google Analytics 4 property. This shows the most popular pages viewed after the homepage:
What are the benefits of using path explorations?
Path explorations are very flexible in that they can be built based on events, page titles or page paths.
The path exploration can be used in different ways compared to the behaviour flow report that existed in Universal Analytics, for example:
- Analyse next or previous page paths to understand consumer journeys
- Understand event interaction combinations for popular user journeys
- Use segments to identify behaviours amongst user cohorts (e.g. new users)
- Use breakdowns to identify behaviours across different journeys (e.g. device)
How can I find path explorations and what features are available?
Get started with path overlap explorations by clicking on the ‘explore’ tab within the left hand navigation menu in your Google Analytics 4 property.
From here, select the ‘path exploration’ option to bring up a path exploration template similar to below:
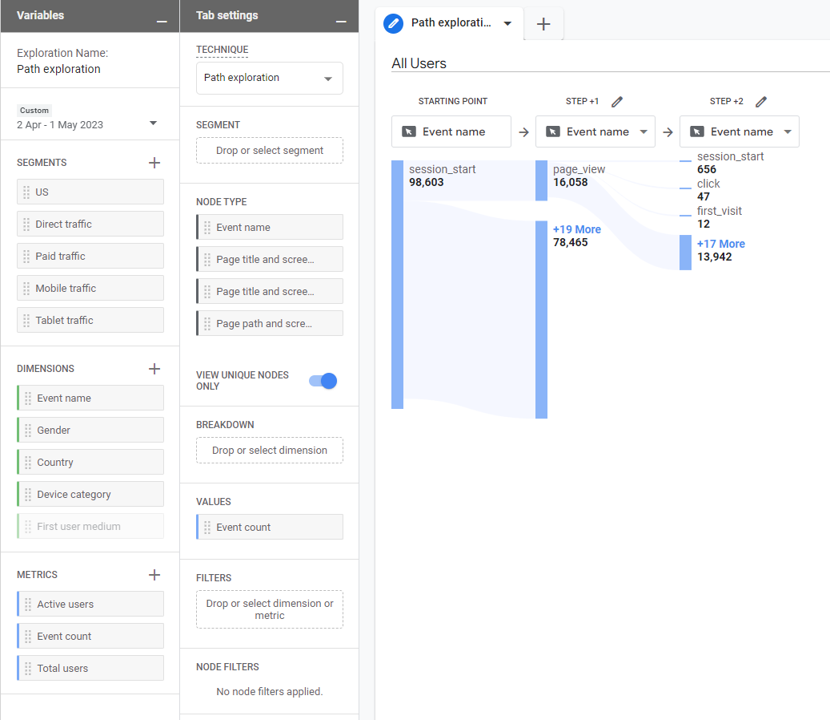
Path explorations are split into three key sections which are variables, tab settings and your visualisation. Each of these are explained further in the sections below.
What is the variables section?
The variables section allows selection of data that is needed for the exploration. There is a variety of options to select from:
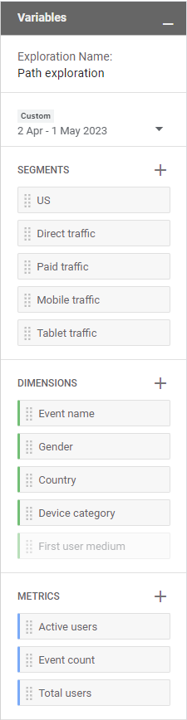
The variables options available include:
- Exploration name – We would recommend choosing a straightforward name that explains the data being visualised within the exploration.
- Date range – Choose between pre-set options provided by Google Analytics 4 such as ‘last 28 days’ or a custom range to match specific needs.
- Segments – Segments can be applied to path explorations to understand user behaviour amongst different cohorts. Some segments are automatically created to get you started or you can create your own segments by clicking on the ‘+’ icon in this section.
- Dimensions – Select the dimensions needed for your path exploration. Dimensions describe data and are usually text as opposed to numbers. In the path exploration, dimensions can be used to provide further breakdowns to your visualisation or can be used to create filters to refine the dataset your path exploration is based on. You can add additional dimensions to those shown, by clicking on the ‘+’ icon in this section.
- Metrics – Select the metric needed for the path exploration. A metric is a quantitative measurement and is always a number as opposed to text.
For example, you may wish to use the ‘total users’ metric if you need to understand the number of users navigating from the home page to other pages.
Metrics can also be used to create filters to further refine the dataset your path exploration is based on.
You can add additional metrics to those shown, by clicking on the ‘+’ icon in this section.
What is the tab settings section?
Tab settings are where data is selected for the path exploration. This includes the segment, node type, breakdown, values and filters:
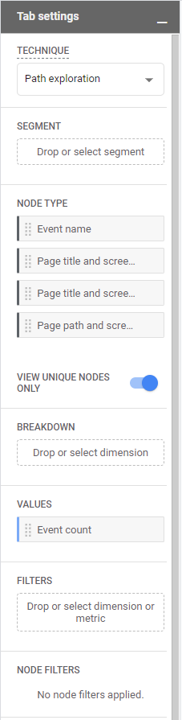
- Segments – Select the segment you wish to apply to your path exploration. You can do this by double clicking on a segment from those listed in the variables section, or alternatively you can drag and drop a chosen segment from the variables section into the segment section in tab settings. The path exploration is designed to use a single segment only. To analyse paths across multiple segments, add a new tab or duplicate the tab you are working on and amend accordingly.
- Node Type – Path explorations come with four different node type options, providing flexibility in how you can use the exploration.Event name allows you to define path steps based on any event collected within your Google Analytics 4 configuration.The page title and screen name node type will display the page title for websites, and the screen name for apps.The page title and screen class node type will display the page title for websites, and the screen class for apps.The page path and screen class node type will display the page path for websites, and the screen class for apps.Underneath the node type options, there is a toggle switch labelled ‘view unique nodes only’. By enabling this option, you will only see one node for a particular event/page/screen at a given step even if they are triggered multiple times on a given page/screen.
- Breakdown – Here you can add a dimension to provide a further breakdown of the path data visualised. For example, adding device category as a breakdown dimension will provide a split of the path data across desktop, mobile and tablet devices. Only one breakdown dimension can be added per path exploration. Should you wish to run breakdowns across additional dimensions, add a new tab or duplicate the tab you are working on and amend accordingly.
- Values – Add the metric that will form the basis of your analysis. For example, you may wish to use the ‘total users’ metric if you wish to understand the number of users navigating from the home page to other pages. Only one metric can be added per path exploration. Should you wish to run analysis across additional metrics, add a new tab or duplicate the tab you are working on and amend accordingly.
- Filters – Apply either a single or multiple filters to refine the data that is included or excluded in the segment overlap exploration. Filters can be based on either metrics or dimensions, and can use a variety of logic such as contains, starts with, exact match and regex match.
What is the visualisation section?
The visualisation section is where the path exploration is viewed. This is the culmination of the configuration in the variables and tab setting sections, and what users of the exploration will see.
The first thing to do will be to define the starting point of your path exploration. By default the starting point is set to the session_start event as below.
To change this to another event, click the vertical blue bar to the left of ‘session_start’. This will bring up a menu similar to the below:
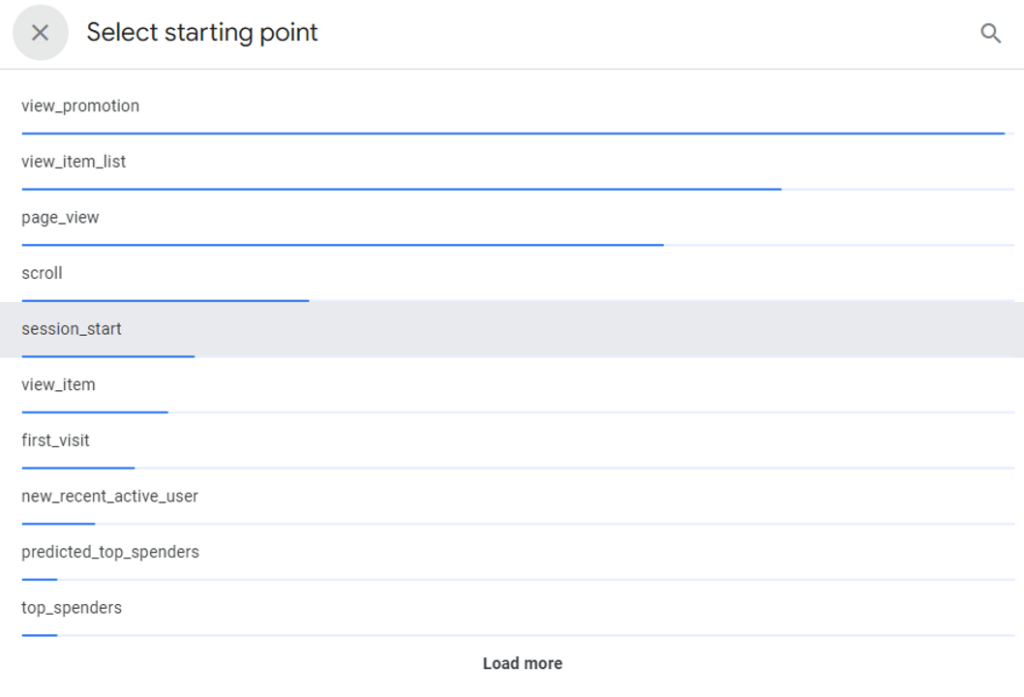
Find the event you wish to switch to and then click on this to update the selection in the visualisation.
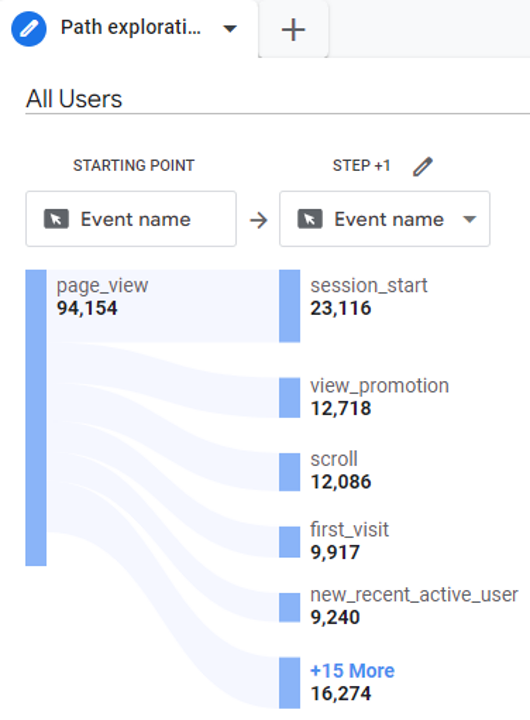
In the example below, I have switched the starting point from ‘session_start’ to ‘page_view’:
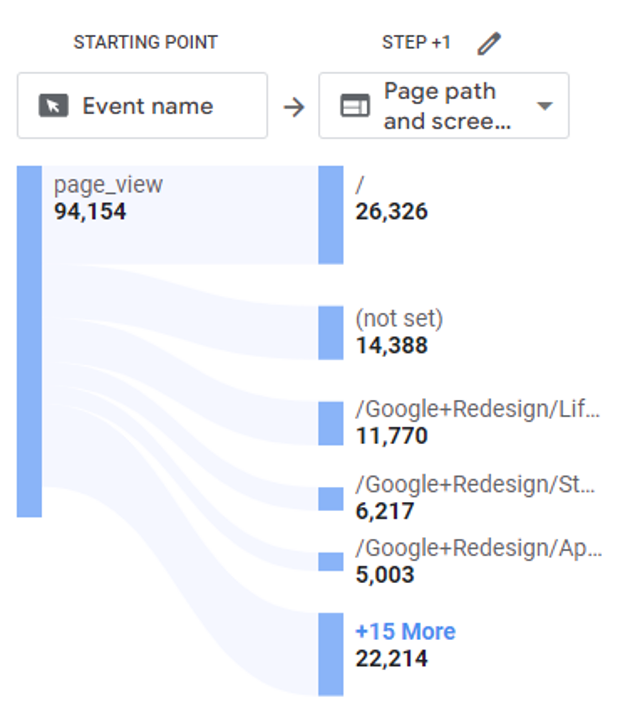
With the starting point defined, the next step is to define the steps by selecting the node type from the drop down list.
For example, if you require the first step to be the page path then you would need to click the dropdown underneath the ‘step +1’ section and change this to the node type ‘page path and screen class’.
Click the +more link to expand the items out further at a step level. For example, if I click on the ‘+15 more’ link in the above, it will provide additional page path data beyond the five most popular.
By clicking on the blue vertical bars next to a page path, it will create an additional step showing onward journeys from that page. For example, if I click on the blue bar to the left of the homepage path (/) it will create the additional step as shown below.
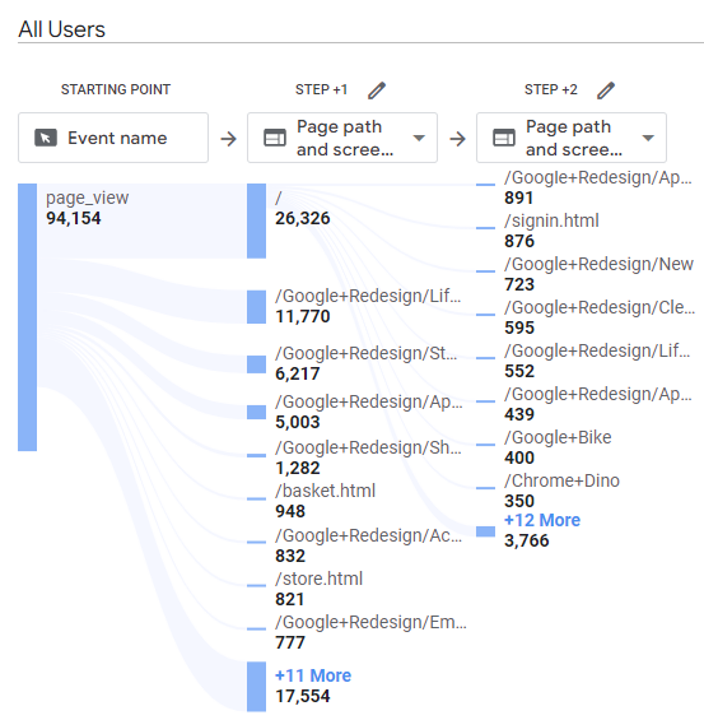
The path exploration also allows the removal of nodes that are not relevant to your analysis. In the above example, we see a (not set) page path appearing. If we wanted to exclude this node from our analysis we can do so by right clicking on the (not set) node, and selecting exclude node. Here, there are two options available where you can exclude the selected node only, or all paths that contain the node.
The example below shows the result of excluding the (not set) node from all paths.
How can I get started using path explorations?
To start using path explorations, consider the potential use cases from an audience perspective.
For example, use the pre-built reports in the interface to view the most frequently viewed pages, from which you can use a path exploration to understand the next steps from these high frequency pages.
The path exploration can also be used on events as well as pages or screen, meaning the exploration can also be used to understand the pattern in which specific events fire. This can be particularly insightful if your Google Analytics 4 configuration has customised events configured.
Some example use cases of path explorations can be found below:
- Find the most popular pages viewed after viewing the homepage
- Discover what actions users take after receiving an error message
- Uncover looping behaviour, which may point to a user experience issue
- Understand how different events form part of a user journey
We recommend investing time in building out explorations in Google Analytics 4 ahead of Universal Analytics being sunset. This will enable a smooth transition from Universal Analytics to Google Analytics 4.
Speak to us if you have any questions around the path exploration in Google Analytics 4.