
Analytics
Data Sampling in Google Analytics 4: What’s changed?
On the 27th of November 2023, Google announced a change to how data is surfaced in Reports and Explorations within the Google Analytics 4 (GA4) interface. Previously found only in Explorations, data sampling will now feature in standard Reports too. In this blog, we’ll explain what exactly this means.
How is data stored in Google Analytics?
To understand what’s changed, we must first look at how data is stored in GA4. GA4 stores data in two kinds of tables:
Pre-aggregated tables
This type of table delivers fast results with pre-analysed data to power reports in the GA4 interface. Queries that use these tables return faster in GA4, the page loads quicker and less computing resources are used.
Granular tables
This type of table holds raw event and user data, and provides greater flexibility of analysis. This means you can get more precise insights out of your data, as the query is against un-aggregated data.
Before the change
Prior to the change, most Reports were pulled from pre-aggregated tables in GA4, while Explorations were pulled from the granular tables.
In Explorations, you were unlikely to see (other), which means that some rows of data have been grouped together in the visualisation, due to the raw data sources it would use.
Similarly, in the Report section, you were unlikely to see sampled data, which occurs when the threshold of raw data is too high to analyse (more than 10 million events (or 1 billion, if you are using Google Analytics 360)). In such cases, Google Analytics selects a percentage and models your data visualisation based on this sample.
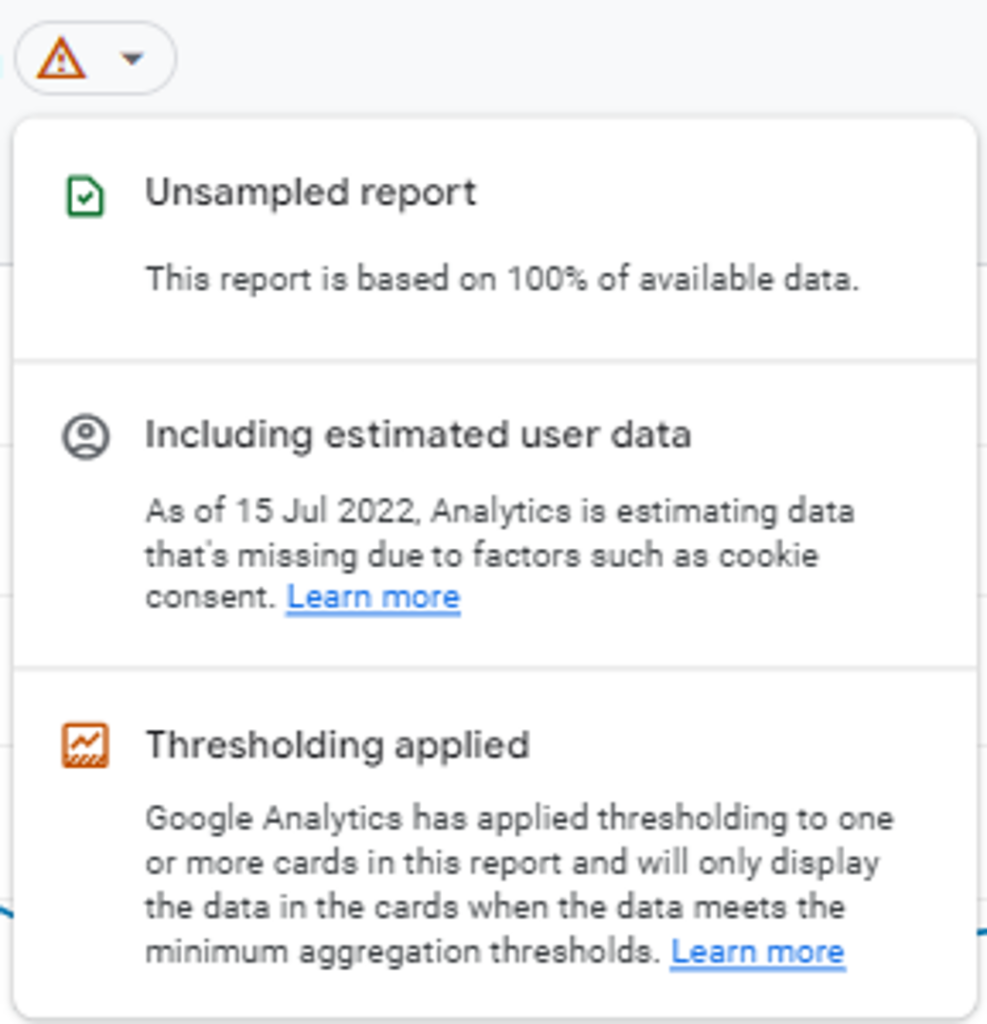
Not to be confused, Sampling is different to Thresholding, which is an alert you will see in the GA4 interface. Thresholding applies when GA4 determines that the analyst will be able to infer sensitive information about an individual website/app user.
After the change
GA4 will now use the table which offers the most ‘accurate’ data for the query. This means you might get a pre-aggregated table powering an Exploration, or a granular table powering a Report.
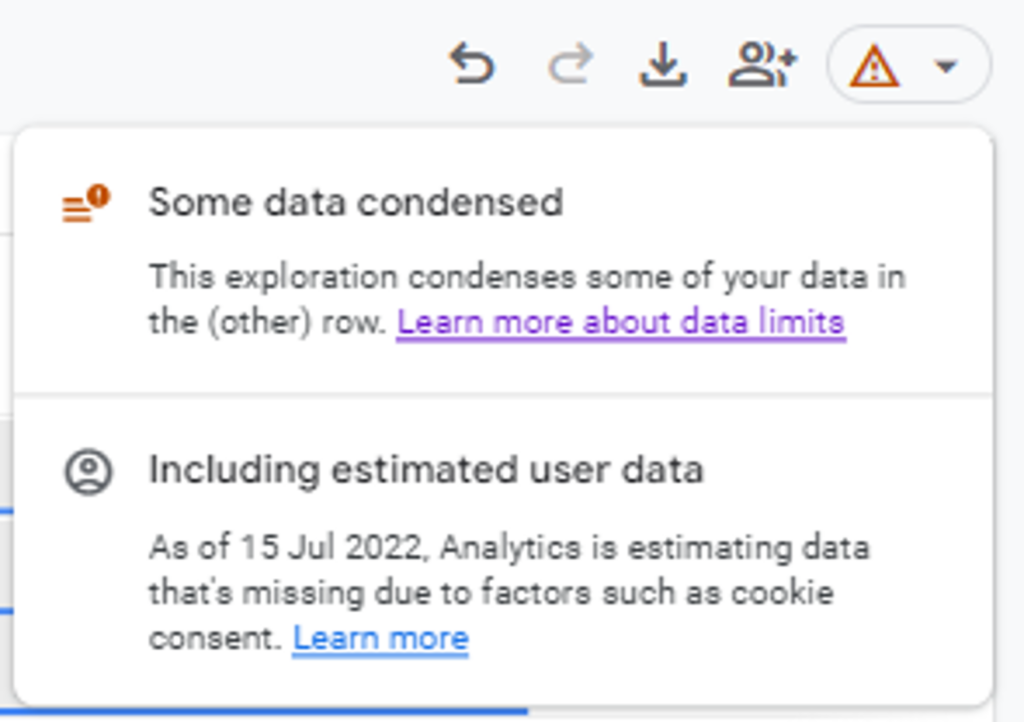
As a result, Explorations may now show a dimension value as (other) if there are too many unique dimension values in a table. You will be alerted when this is the case:
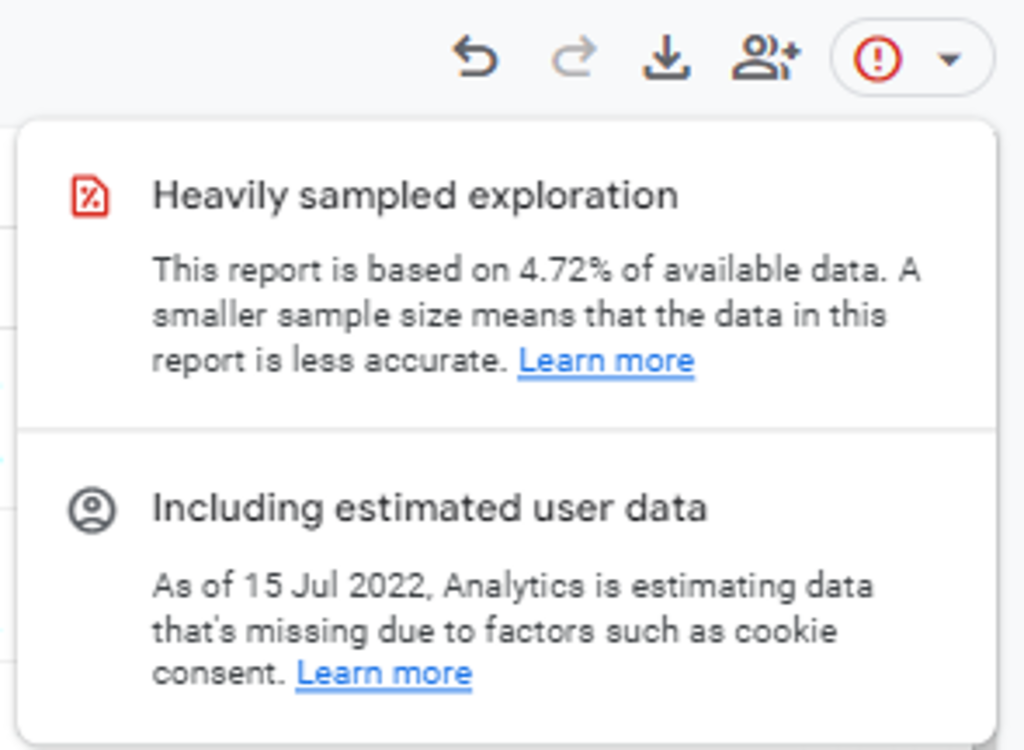
Additionally, in Reports, if a granular table is used instead of a pre-aggregated table, then you are more likely to see sampled data (you will also be alerted of this):
What to do
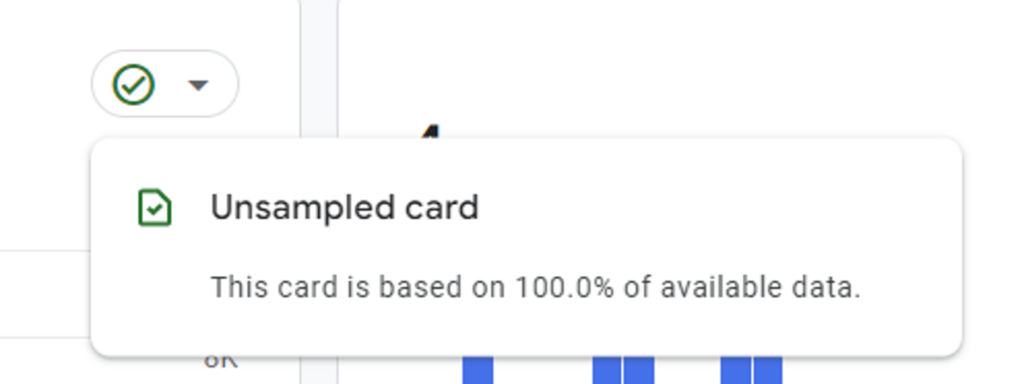
It is important that you are aware of the quality of your data in the GA4 interface. Whenever you are looking at a report, check the green tick next to a visualisation. If it is green, then you are not seeing sampled data.
However, if you are seeing sampled data, select “More detailed results” in an Exploration, or reduce your query size in a Report to ensure you are making decisions based on the most accurate and granular data available.
Please speak with us if you have any questions around this updated functionality.