
Media
A guide to auction insight analysis
Part 2: Starting your analysis
Following the first part of this series where we looked at the different ways of accessing Auction Insight data, this article will cover conducting your analysis and pulling out insight.
Laying the groundwork
Once you have accessed the data, you’re ready to start your analysis. Firstly, make sure you have read through this help centre article explaining what each of the metrics you’ll be looking at are showing.
Please note that auction insights does not provide absolute data, but only data for the auctions you have entered. Don’t expect to get an accurate view of the Search Engine Results Page (SERP) from a keyword where you only hold 15% impression share.
The six search metrics available breakdown into two categories, SERP and Domain-Relative:
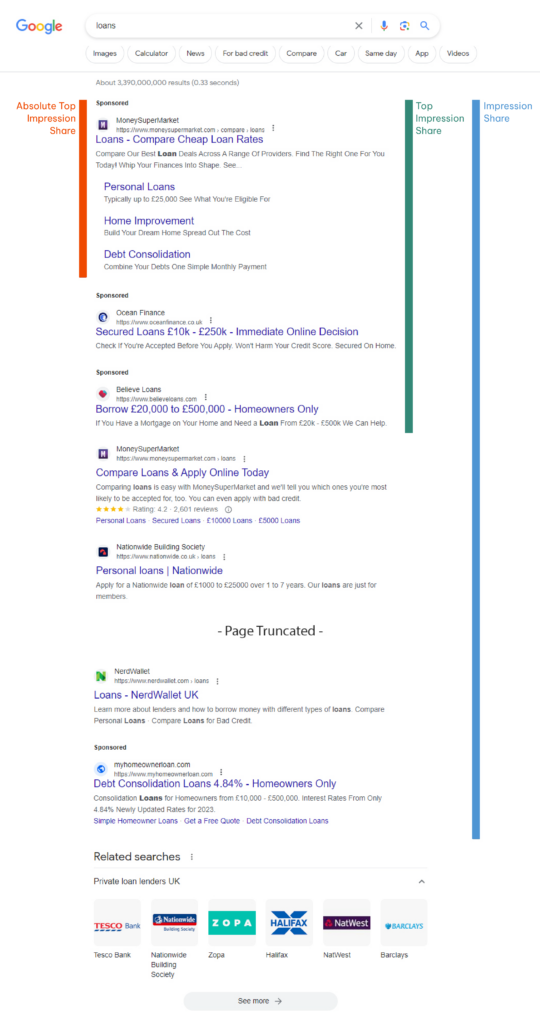
SERP metrics
- Impression Share
- Top Impression Share
- Absolute Top Impression Share
These all use the position on the SERP as the reference point; is the domain on the first page at all, at the top of the page or the absolute top of the page? Here’s a quick visual of how this looks:
Domain-relative metrics
- Overlap Rate
- Outranking Share
- Position Above Rate
These are all in comparison to your domain (referred to as “You” in the auction insights report); how often did you appear above domain X, or alongside domain Y etc?
Whilst domain-relative metrics can be useful diagnostic tools, if you’ve not done this kind of analysis before, we recommend focusing on the following two SERP metrics:
Impression Share
Use impression share as an indicator of coverage in the SERP. High impression share will require a competitive ad rank and most importantly, enough daily budget to meet search demand.
Absolute Top Impression Share
Use absolute top impression share as an indicator of how aggressive a competitor is bidding; the higher the absolute top impression share, the greater the ad rank and the likelihood of a higher bid.
Starting your competitor analysis
With this as a framework, you can start to categorise your auction insights data into a competitive matrix, placing each competitor somewhere between the following four quadrants:
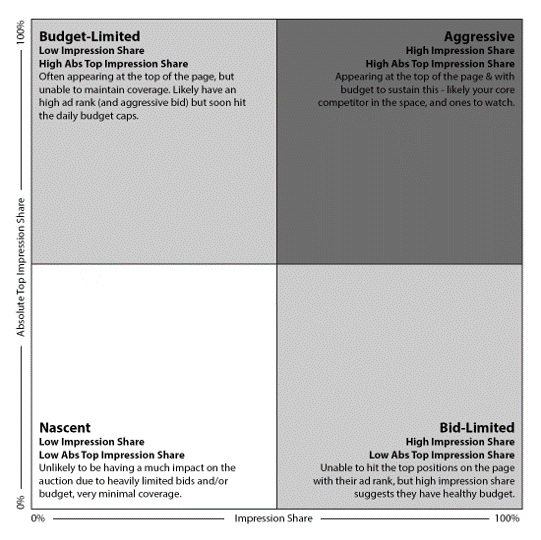
This is simplified due to the interconnected nature of these metrics; take this as a starting point.
With this in place, you’ll know which domains you need to keep an eye on, and which domains you can (for now) filter out of your analysis. This can also tell you something about the auction as a whole – are you finding competitors cluster in one segment?
The next step is then mapping changes in performance (especially Cost Per Click (CPC) and Click Through Rate (CTR)) back to changes in the competitor set. It’s important to be very conscious of external factors such as changes you are making to the account, or expected seasonality, to avoid drawing erroneous conclusions.
Running through an example
A campaign you’re running saw a significant CPC spike over the last month. Without any notable changes in bidding or copy, you suspect the competitor set might have shifted.
You jump into your auction insights dashboard and can see a new competitor entering with an medium-high impression share and absolute top impression share, but with little change across the wider competitor set.
The key thing to look at when carrying out your analysis is progression over time. A snapshot of a month can be useful in working out what the field looks like, but its is the progression over time that matters most in unpicking what’s happening.
After reviewing the data, the dates match up between this competitor (in pink below) entering the auction and a CPC spike (in black below).
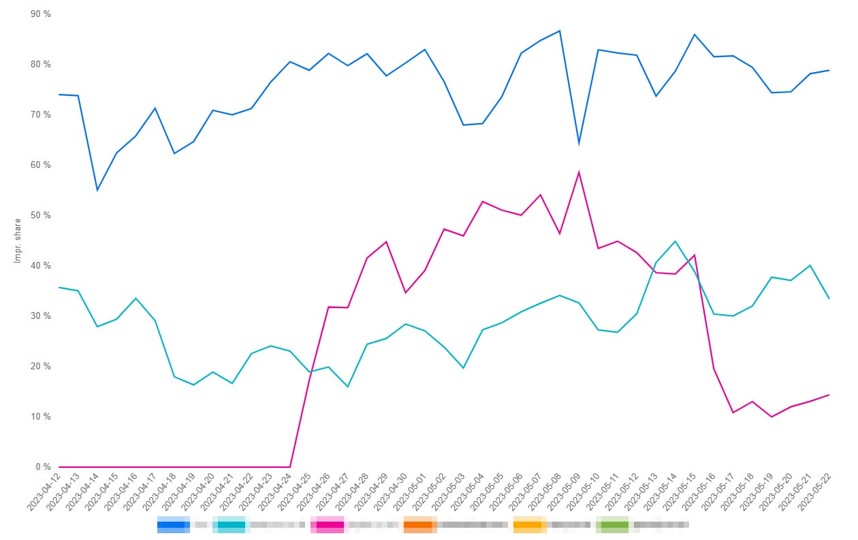
Impression Share
We can see that this competitor pushed for one month before dropping back (but not out entirely), with CPCs seeming to follow. The closely matching shape across both graphs suggests they could be driving this CPC increase.
Based on the framework above, this would put them towards the top-right Aggressive segment during the middle of the month, before dropping back towards the bottom-left Nascent segment as they pull back.
Whilst you could stop here, auction insights analysis leads nicely into competitor research. The next step is to review the competitor’s ad and website – what is their offering, what is their message and target audience, and how do they stack up in the market?
You might find one of the following:
- The website looks quite low quality with a cheap domain name, and weak ad units. This is combined with low product price and a prominent voucher code, leaving them little room for margin:
- Could the tactic have been to “burn bright” for a short period of time and see if paid search is an effective acquisition channel? If so, they may drop out quickly if not seeing success.
- The website looks professional, with a solid product offering that is backed by another large company. Plus, you’ve found evidence of branding ads using tools like Meta Ad Library:
- In this case, the signs suggest you may be seeing a new core competitor enter the space who is less likely to just drop out, and more likely to push into the top right box – what is your strategy to deal with this in future?
As with most things in life, there is no way to know for certain what will happen.
What is certain is that account stakeholders (such as clients or CMOs) will be more receptive to thorough analysis based on auction insights and competitor research, than to a simple assertion that CPCs are up, efficiency is down, and (we hope) things will get better.
The final part of this series will delve into some tips and tricks for auction insights analysis to ensure you’re getting the most out of the data available. Watch this space.