
Google Analytics 4
A guide to attribution in Google Analytics 4
Attribution is the process of assigning credit for conversions back to marketing touchpoints. An attribution model is used to determine the method of how touchpoints are credited with a conversion.
In Google’s Universal Analytics (and its preceding versions) a last click model was used, which assigned conversions based on the last non-direct marketing touchpoint.
In Google Analytics 4, data-driven attribution is used as the default model. A data-driven model assigns credit across all marketing touchpoints involved in the conversion, and uses machine learning to create a statistical model which assigns conversion credit based on the behaviour of your website users. This is a huge step forward in how we as marketers measure and understand marketing performance.
This guide covers our observations from analysing attribution data in Google Analytics 4, and what you need to consider and look out for when using this data.
In this guide:
- Attribution before Google Analytics 4
- Goodbye to hard-coded last click attribution
- Data-driven attribution is here
- Data-driven attribution is not always data-driven
- Data-driven attribution does not apply to all reports in Google Analytics 4
- Key takeaways
Attribution before Google Analytics 4
Before the introduction of Google Analytics 4, attribution in Universal Analytics (and its preceding versions) was based on a last non-direct click model.
Whilst a simple concept to grasp, over time the last click model has become extremely limiting in measuring marketing performance effectively. This is because user journeys have become more complex, with the norm now being multiple touchpoints on route to a conversion.
Basing marketing investment decisions on a single last click touchpoint is not reflective of actual user behaviour.
Despite the Universal Analytics dataset evolving, offering metrics such as assisted conversions and alternative heuristic attribution models in multi-channel funnel reports, core reporting in the Universal Analytics interface has always been hard-coded to the last click model.
With the launch of Google Analytics 4, there are two exciting developments that will change the way we think about attribution.
1. Goodbye to hard-coded last click attribution
The Google Analytics 4 dataset is no longer hard-coded to the last non-direct click model. This is a huge change and a really positive step forward for Google Analytics 4.
Within the admin settings of Google Analytics 4, there is an attribution settings section where you can define the attribution model that you want to default your reporting to:
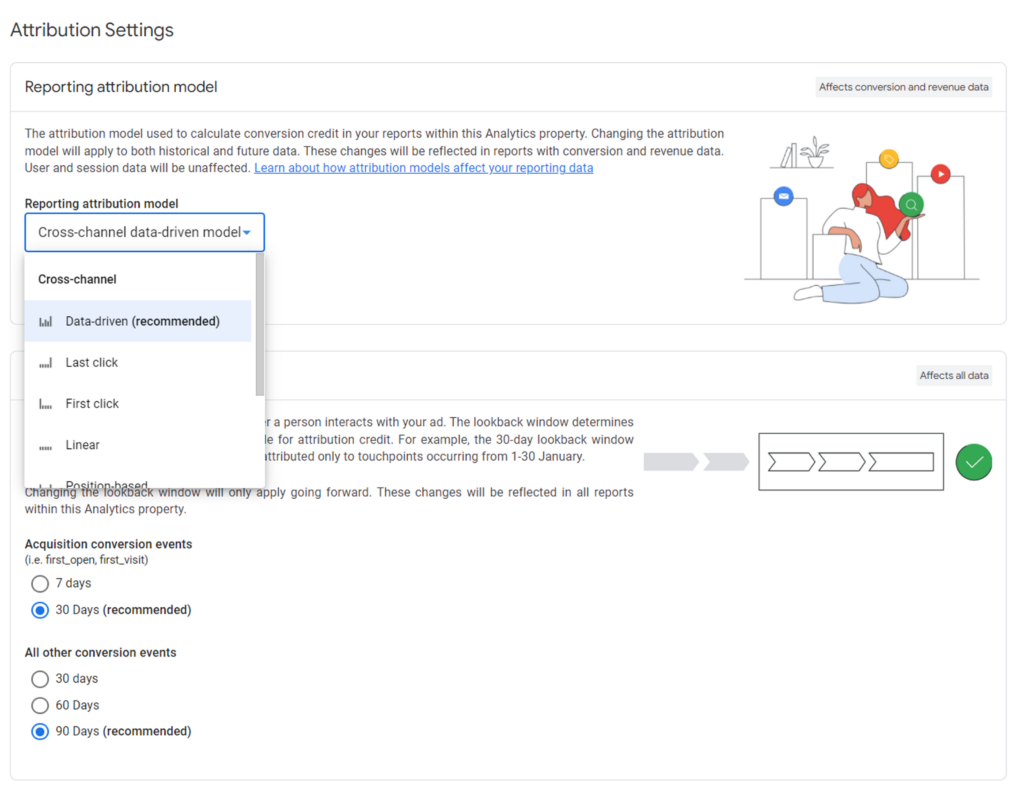
Better still, this setting works on-the-fly meaning that you can change your reporting attribution model at any time without permanently altering the underlying dataset. When you change the attribution model using these settings, it will apply to both historical and future data.
2. Data-driven attribution is here
Google Analytics 4 offers a data-driven attribution model and, better still, this is available across both the standard and enterprise (i.e. 360) versions. This means that we, as marketers, can now judge marketing performance on a wider spectrum of touchpoints using a statistical model that is tailored to the behaviour of our website users.
Furthermore, data-driven attribution is now the default model selected within the attribution settings. This means that you can take advantage of data-driven attribution immediately without having to complete any additional configuration steps.
At face value these two initiatives seem like a welcome and much needed development, and provide a significant advantage for early adoption of Google Analytics 4. However, from our investigations and analysis of this data, there are a few important points and nuances to be aware of when analysing conversions data by channel.
Data-driven attribution is not always data-driven
Data-driven attribution is an algorithmic model that relies on machine learning techniques to attribute conversions across multiple touchpoints.
As with any statistical analysis and modelling, the sample size of the underlying conversion data is critical.
We have observed that, if the sample size of conversions is too small, the data-driven attribution will default back to the last non-direct click model.
Using the model comparison tool in Google Analytics 4, we see last click and data-driven return identical results in the example below:
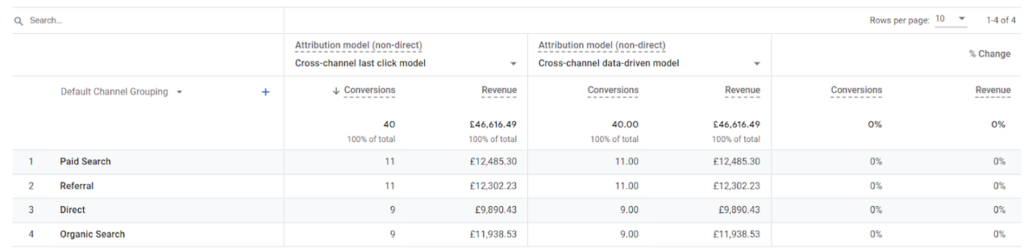
This is an example where the number of conversions is not large enough for data-driven attribution to take effect, resulting in the data-driven model returning the same results as last click. This is not made very clear within the interface, as the ‘cross channel data-driven model’ dimension label does not change.
At the time of writing, documentation on data-driven attribution in Google Analytics 4 does not state what the minimum sample size is. What we do know is, in Universal Analytics 360, data-driven attribution needs circa 500 conversions in a monthly period. Whilst not yet confirmed via Google’s documentation, it is entirely plausible that Google Analytics 4 will be working to similar constraints.
We recommend you use the model comparison tool in Google Analytics 4 to check that your data-driven attribution model really is data-driven.
Data-driven attribution does not apply to all reports in Google Analytics 4
Let’s suppose you have run the above check using the model comparison tool, and have determined that your data-driven model is in fact data-driven.
From our investigations, however, all is not as it seems and we have seen that the data-driven model (or the default model you have selected in attribution settings) does not apply to all reports in Google Analytics 4.
Let’s talk through an example. We assume throughout the rest of this guide that the attribution settings have been left as the default data-driven setting.
We begin by checking we are not limited by sample size by using the model comparison report.
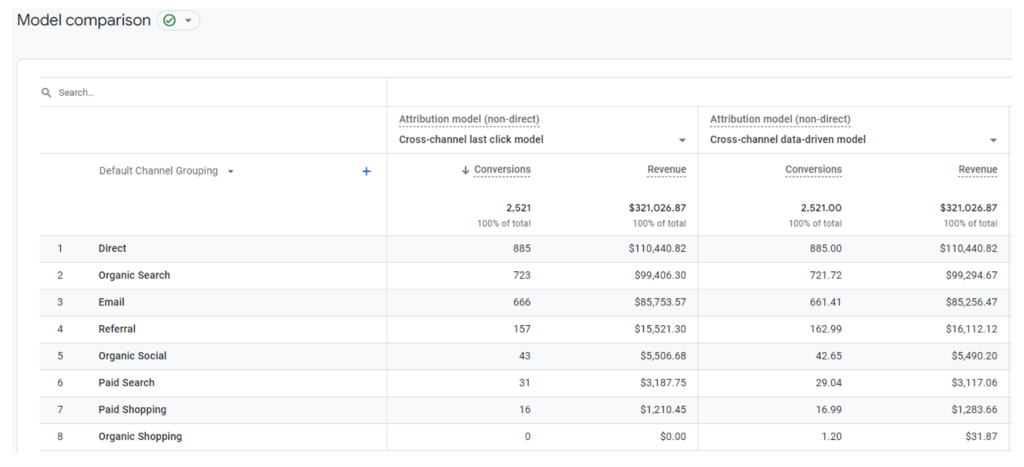
The below example looks good for our data-driven attribution model. It is clearly returning different results from the last click model.
Next, lets retrieve conversions data by channel grouping using other Google Analytics 4 reports and analysing the results returned.
The conversions report uses the data-driven model
The conversions report in Google Analytics 4 is a pre-built report that will give you a read on conversions by channel grouping. The expectation is that the conversions report will return conversion data based on the data-driven attribution model.
And this is indeed the case – below is an example of the output for the conversions report, which matches the results in the model comparison report for the data-driven model:
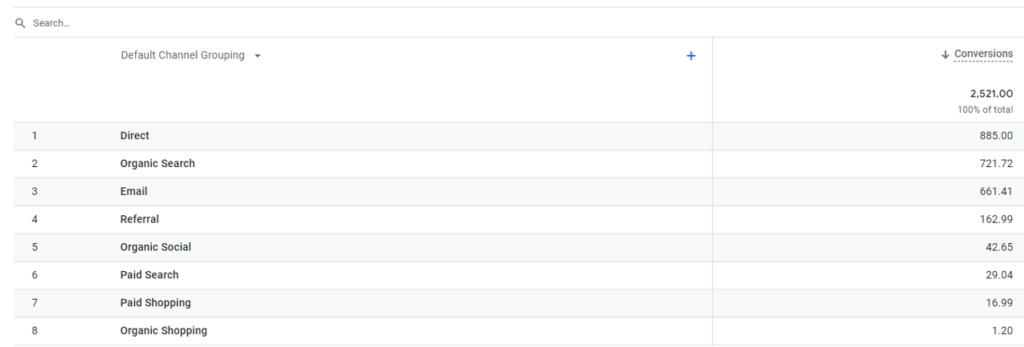
This observation confirms that the conversions report in Google Analytics 4 is based on the data-driven model. So far, so good.
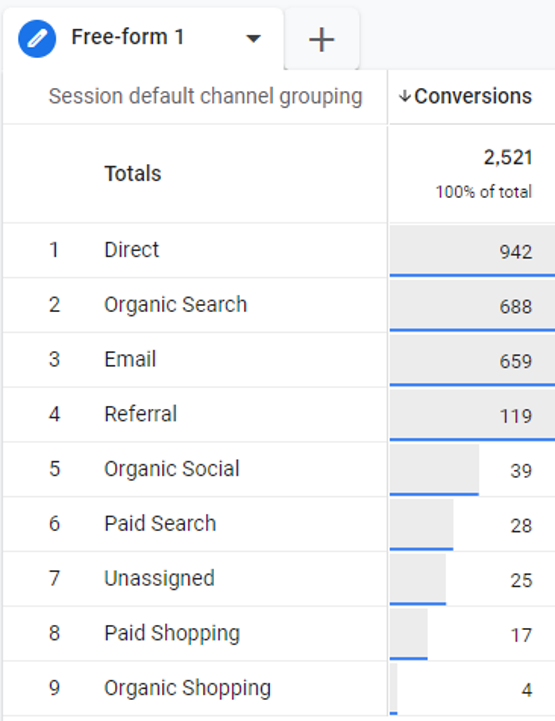
The traffic acquisition report uses a single touch model
The traffic acquisition report is another way of analysing conversions by default channel grouping in Google Analytics 4.
Let’s check the output of this report based on our same example as above:
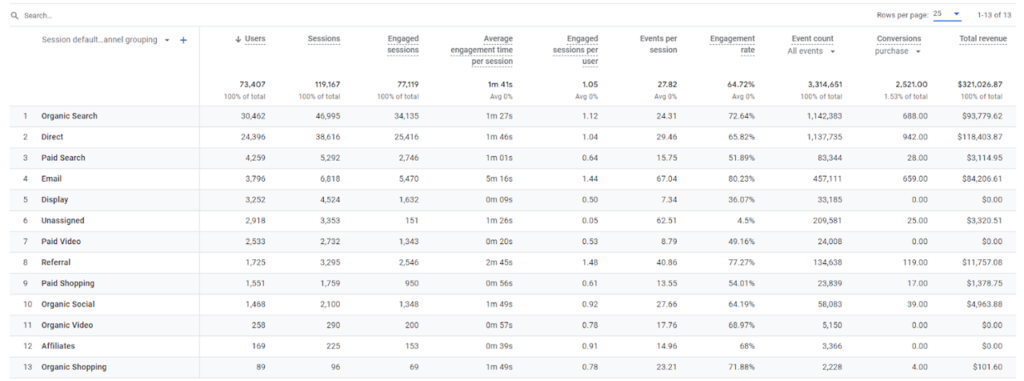
The reporting of conversions data by channel has three very interesting and significant observations:
- The results returned by channel are very different from the model comparison and conversion reports.
- The conversion volumes for each channel are whole numbers, which is a very strong indication that a single touch model is being used in this report.
- This report is based on session level channel grouping, which is different to the model comparison and conversion reports.
These are important observations to call out, as our expectation would be this report would be using the data-driven model too and that we would see consistent results to the conversions report. This is clearly not the case.
It is not entirely clear what attribution model is being used here. Given this report is using session based data, we cannot use the model comparison report to compare.
Our observations indicate that a single touch model is being used, and it is plausible that will be the last click model.
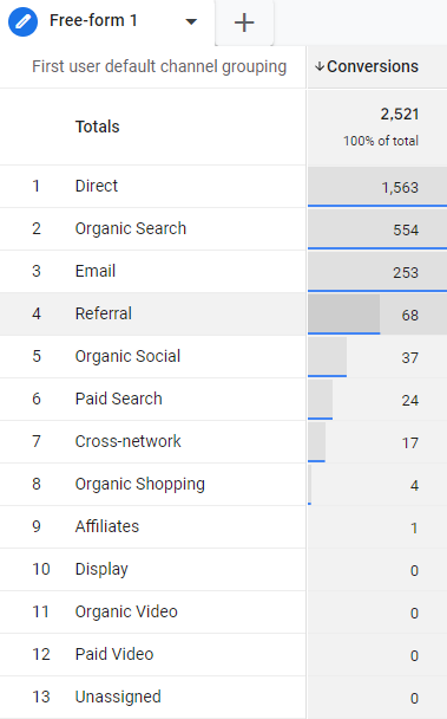
The user acquisition report also uses a single touch model
The user acquisition report allows us to understand performance by channel based on first user interaction. It is another report where we can compare conversion performance by channel. Let’s check the output of this report based on the same example:
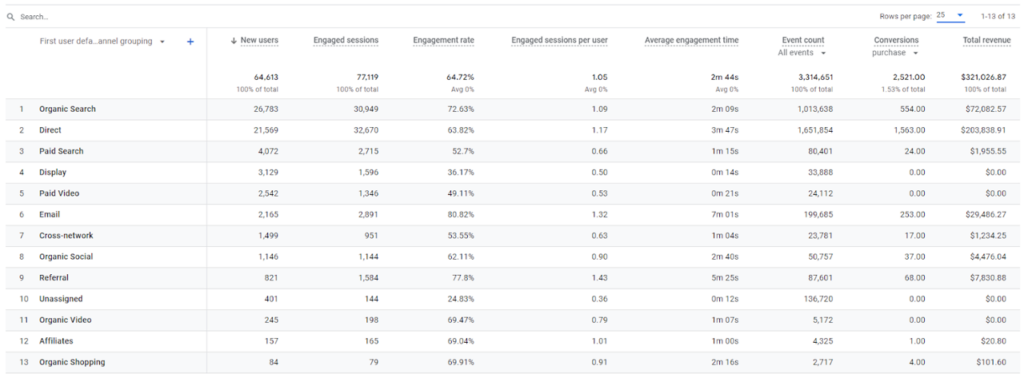
Again, the reporting of conversions data by channel has some interesting learnings:
- The results returned by channel are very different from the model comparison, conversion and traffic acquisition reports.
- The conversion volumes for each channel are whole numbers, indicating a single touch model is being used.
- This report is based on first interaction user level channel grouping, which is different to the model comparison, conversion and traffic acquisition reports.
As with the traffic acquisition report, a data-driven model is clearly not being used here and we cannot use the model comparison report to compare as first interaction user based data is being used. It is likely that a single touch model is being used, and it is plausible that it will be the first click model, given the report is based on first user interaction.
For both the traffic acquisition reports and the user acquisition reports, the use of a different model has the potential to cause significant confusion and create a scenario of multiple sources of truth. The attribution model being used in these cannot be changed.
The exploration report reinforces the above observations
Finally, let’s create a series of exploration reports to monitor data output based on the same example.
Google Analytics 4 has significantly reduced the number of pre-built reports in the interface. The emphasis has very much shifted to using explorations to build reports, so clarity on what is being used here is really important.
When we start creating an exploration, and search for ‘channel grouping’ in the dimensions picker, this mirrors our above observation in that there are three scopes of channel grouping: first user interaction, session based and default:
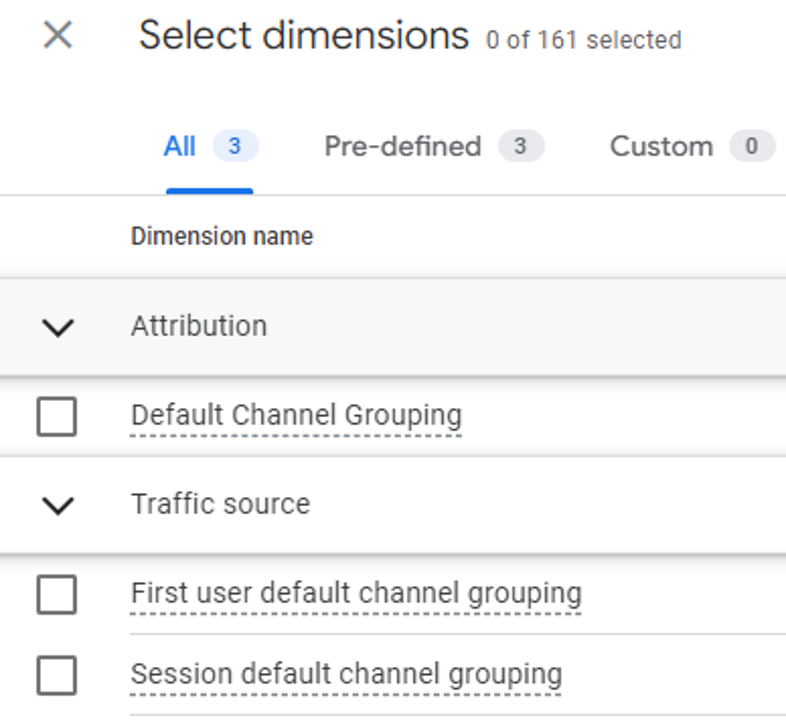
Let’s build a simple report of channel group vs conversions for each of the three dimensions above and review the output.
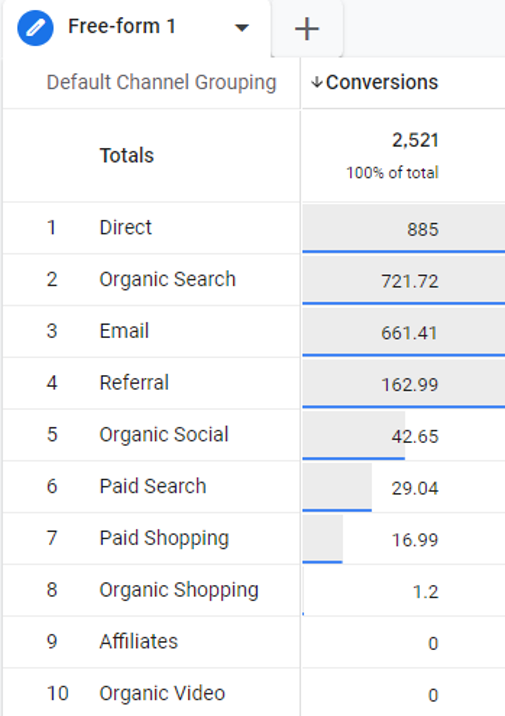
Default channel grouping uses data-driven attribution
When we use the attribution default channel grouping, this returns identical results that we have observed in both the model comparison and conversion reports.
This confirms that when you use the attribution default channel grouping in exploration reports, this is based on the data-driven model.
First user channel grouping matches user acquisition report
When we use the first user channel grouping, this returns identical results that we observed in the user acquisition report.
This confirms that when you use the first user channel grouping in exploration reports, this is based on a single touch model that is most likely to be first click.
Session channel grouping matches traffic acquisition report
When we use the session user channel grouping, this returns identical results that we observed in the traffic acquisition report.
This confirms that when you use the session channel grouping in exploration reports, this is based on a single touch model that is most likely to be last click.
Key takeaways and closing thoughts
The move to data-driven attribution in Google Analytics 4 is an exciting one and something that has been long overdue. However, our analysis of attribution data in Google Analytics 4 has highlighted significant observations that all Google Analytics 4 users must be aware of to avoid incorrect analysis and mis-interpretation of data.
Our key takeaways are summarised below:
- Data-driven attribution isn’t always data-driven. If your sample size of conversions are too small, then the data showing under your data-driven attribution model will return the same results as the last click model.
- You can check this very easily using the model comparison report in the Google Analytics 4 interface.
- The data-driven attribution model is not applied to all your reports. This means that you will get a different breakdown of conversions per channel depending on the report you are analysing in Google Analytics 4. These can be categorised into three different buckets as explained below.
- Data-driven attribution only applies to the conversions report or exploration reports that use the attribution default channel grouping dimension.
- The user acquisition report, and explorations using the first user channel grouping dimension, both return results that are not using a data-driven model. These reports appear to be using a single touch model which is likely to be reflective of a first click model.
- The traffic acquisition report, and explorations using the session channel grouping dimension, both return results that are not using a data-driven model. These reports appear to be using a single touch model which is likely to be reflective of a last click model.
Attribution in Google Analytics 4 works very differently to Universal Analytics and its preceding versions, and the different scenarios above will quickly lead to multiple sources of truth if your users of Google Analytics 4 are not aware of the nuances we have uncovered in this guide.
Please speak to us if you have any questions around attribution in Google Analytics 4.