
Analytics
A look at Google Tag Manager’s latest updates
Since its release over 11 years ago, Google Tag Manager (GTM) has been a game changer for marketers and analysts alike by empowering those without web development knowledge to create, maintain and enhance tracking. From simple conversion counting to complex first-party data collection and front-end manipulation, GTM has evolved over the years to become an invaluable tool in driving businesses’ growth strategies forward.
The latest evolution of GTM has just been released, solving some of the problems we have simply had to compensate for in the past. Not only will the new features put a smile on the face of those directly responsible for managing a GTM container, but there’s also some practical applications for those needing to work cross-team, or even cross-agency, to diagnose any tracking issues.
This article will look at exactly what these new features bring to the table, as well as how you can use these to improve your workflow.
New Feature 1: Container / Tag Details
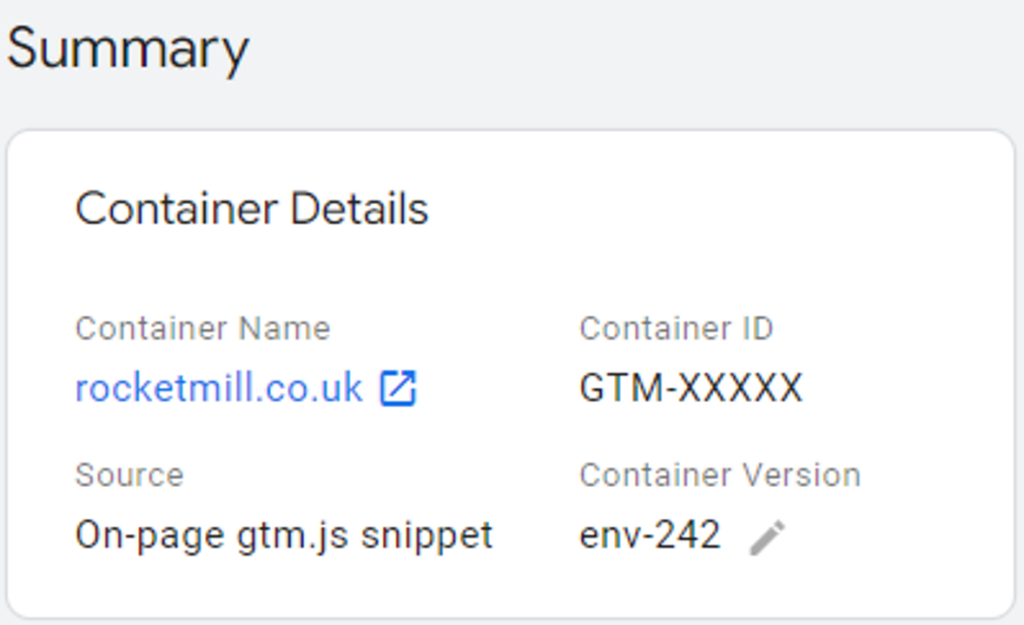
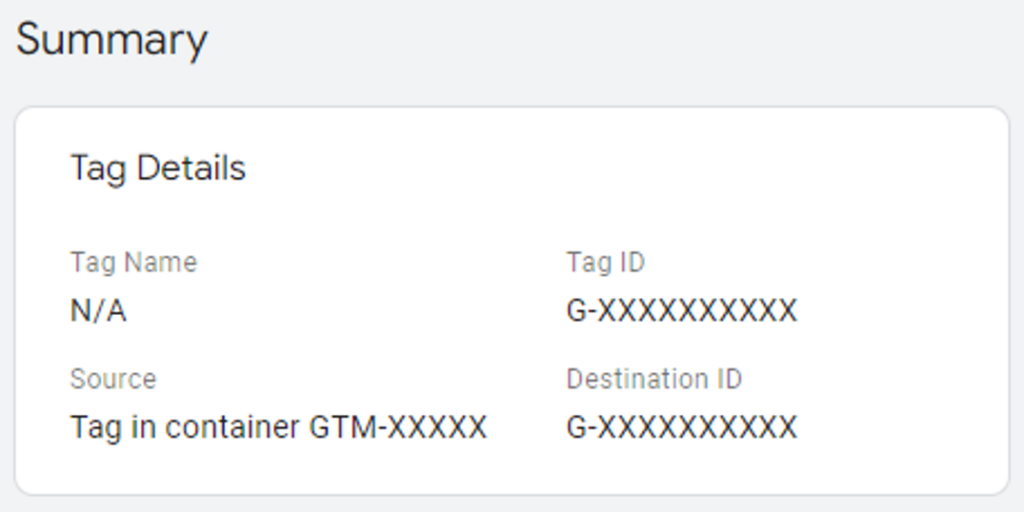
When using GTM’s built-in preview and debug tool, Tag Assistant, you will be shown a brand new section in the summary entitled Container Details or Tag Details:
- Container Details on first look is not particularly revolutionary, appearing as a handy consolidation of details that previously would have been found in different areas: Container Name, ID, Version and Source. This appears when specifically debugging GTM containers themselves.
- Tag Details however, which appears when debugging a gtag-native installation, proves to be particularly helpful. When debugging gtag-native products, perhaps most commonly seen when Google Analytics 4 (GA4) is present on a page, the Source field is valuable in telling where GA4 is installed and being served from.
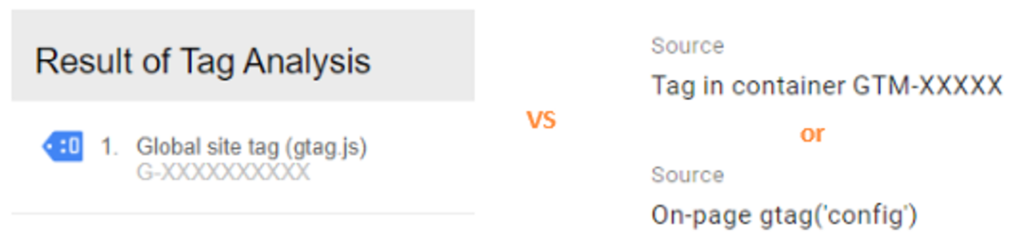
 When using the trusty, old Tag Assistant Legacy browser extension (which despite Google flagging was deprecated some time ago still proves to be a quick and handy diagnosis tool) the whereabouts of GA4 was always a mystery. In all instances GA4 would show the ‘(gtag.js)’ suffix as any hardcoded gtag script would, even if it was installed via GTM.
 The new Tag Details box removes that mystery altogether. This particularly comes in handy when diagnosing a site you do not hold GTM permissions for using the Tag Assistant Companion browser extension, the confusingly named and supposed replacement to Tag Assistant Legacy (which in practice is just GTM’s Tag Assistant outside of GTM.)
Whilst without direct GTM access you won’t be able to see inside a GTM container, anything gtag-native will be on full display – and now showing where it is installed via the Tag Details Source field.
New Feature 2: Import / Export Debug Session
When debugging the tracking on a website, you are able to view the data being served, captured and recorded upon certain interactions whilst the Tag Assistant window is still open in your browser. Once you have finished your debugging session and closed the window, the view of the data then disappears.
This made it somewhat tricky to detail an issue when collaborating with others, typically requiring a mixture of screenshots, screen recordings and, at the very least, doing your best to describe an abstract and complex problem through conversational terms.
To give an example, let’s say you are a marketer tasked with making sure that purchase conversions are being correctly reported for an online store. Upon going through the checkout process yourself with the Tag Assistant preview open, you see that in the moment the transaction happens the total sale amount is not available for capture. This will inhibit Google Ads’ ability to report on revenue generated, and the best course of action is to brief the site developers to amend the code being served by the page on purchase. How would you best demonstrate the problem that is occurring, and therefore what needs to happen instead?
Luckily, a large pain point has now been removed with the introduction of importing and exporting debug sessions.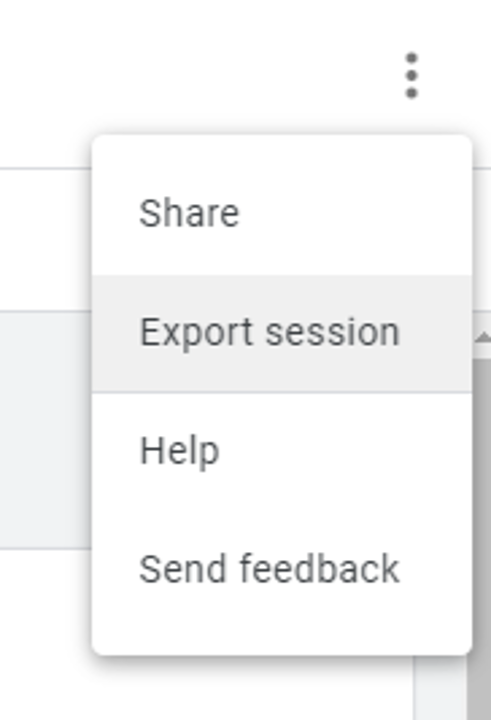
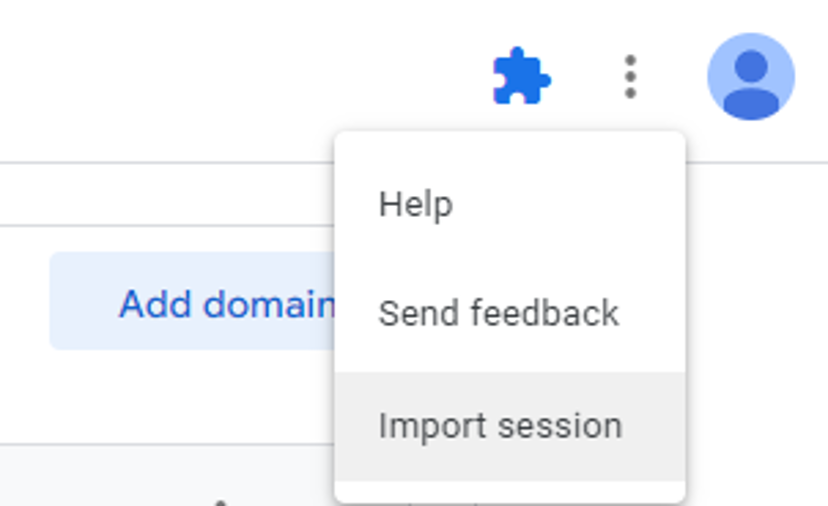
Once the interactions of interest have been performed locally with the Tag Assistant window running, upon clicking the overflow menu you will now be given the option to Export session, which will download to your local machine in the form of a .json file.
This file can then be saved for later use, or sent to a collaborator for them to import into Tag Assistant (or even Tag Assistant Companion) upon start-up.
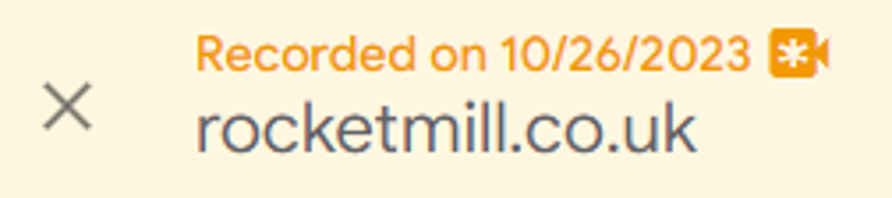
You can then access the previously exported session by opening the overflow menu when a debugging session is not in progress. This will display all the details on-screen, covering the entire session, as if the original debugging session had never been closed.
What is particularly noteworthy about this feature is that users without direct GTM access will be able to see all interactions that occur and the contents of the Data Layer at each stage, without restriction, by simply importing using Tag Assistant Companion.
Aside from this, as the export is in .json format, this also opens up options to import into other platforms as well for alternative applications and use of the data.
It is also worth noting that the export files tend to be rather large in file size, so file sharing is best performed via methods other than attaching them to an email.
Is there a risk to data privacy in doing so?
Potentially, yes. In the example above, it is apparent that as GTM access permissions are not required to see the details of a debug session export, anyone who gains access to the export file will be able to see what is contained within. Whilst Personally Identifiable Information (PII) will be restricted to whatever has been captured locally during the debugging session it is sourced from, it will also provide a consolidated view of all of the tags and events you are using for driving your strategy – something you wouldn’t want to fall into the hands of a direct competitor.
There is more to highlight on the PII side of things too. In the original example of testing a purchase on an online store, if the email, telephone number and billing address all relate to you personally rather than the company you are working on behalf of, you would potentially put your own PII at risk by having it captured and included in the export.
PII of external website users however should not be of concern – remember that the exported sessions are via local debugging, and therefore any data being presented would not represent another person or party browsing the website from a different location, or even a different computer from the same location. If there was any way of retrieving a customer’s personal data using this method, this would point to a fundamental site issue that would have wider implications for those responsible to deal with immediately.
Our thoughts on the latest Google Tag Manager updates
Long-time tag management practitioners are going to be very grateful and excited about the latest update. It also raises the question: what other long standing problems could be solved in a similar way?
No doubt, the creative GTM community will come up with additional ways and practical applications for exporting and storing debug sessions in the coming weeks.
If you would like to know more about importing and exporting sessions from GTM, Google’s official documentation can be found here.